

 Concalls
 Annual reports
Walk into any furniture or home goods store in urban or semi-urban India and you will likely find a Sleepwell or a Kurlon mattress on the floor. Sheela Foam, the company behind both brands, has been manufacturing polyurethane foam since 1971. It is India's largest organised mattress manufacturer, built on a product category most consumers think about only once every several years, at the point of purchase.
What makes Sheela Foam worth examining carefully in 2026 is not its past but its current transition. In FY24, the company acquired Kurlon, a brand with recall in southern and western India equal to or exceeding Sleepwell's. The acquisition was substantial enough that consolidated borrowings jumped from Rs 571 crore in FY23 to Rs 1,493 crore in FY24 to fund it, and total assets nearly doubled. In doing so, Sheela went from being a regional player with national ambitions to a company that controls two of the three most recognised mattress names in the country. The financials examined in this blog answer one question: has this transformation been executed well enough to justify the price paid for it?
How Sheela Foam Actually Makes Money
Sheela Foam is, at its core, a manufacturer-marketer. It converts petrochemical inputs, primarily polyol and toluene diisocyanate (TDI, a reactive chemical compound that gives foam its structure and density), into blocks of polyurethane foam. Those foam blocks are cut, layered, quilted, and assembled into mattresses under its branded portfolio. The finished product moves through exclusive branded outlets, multi-brand dealers, large-format retail stores, and e-commerce platforms.
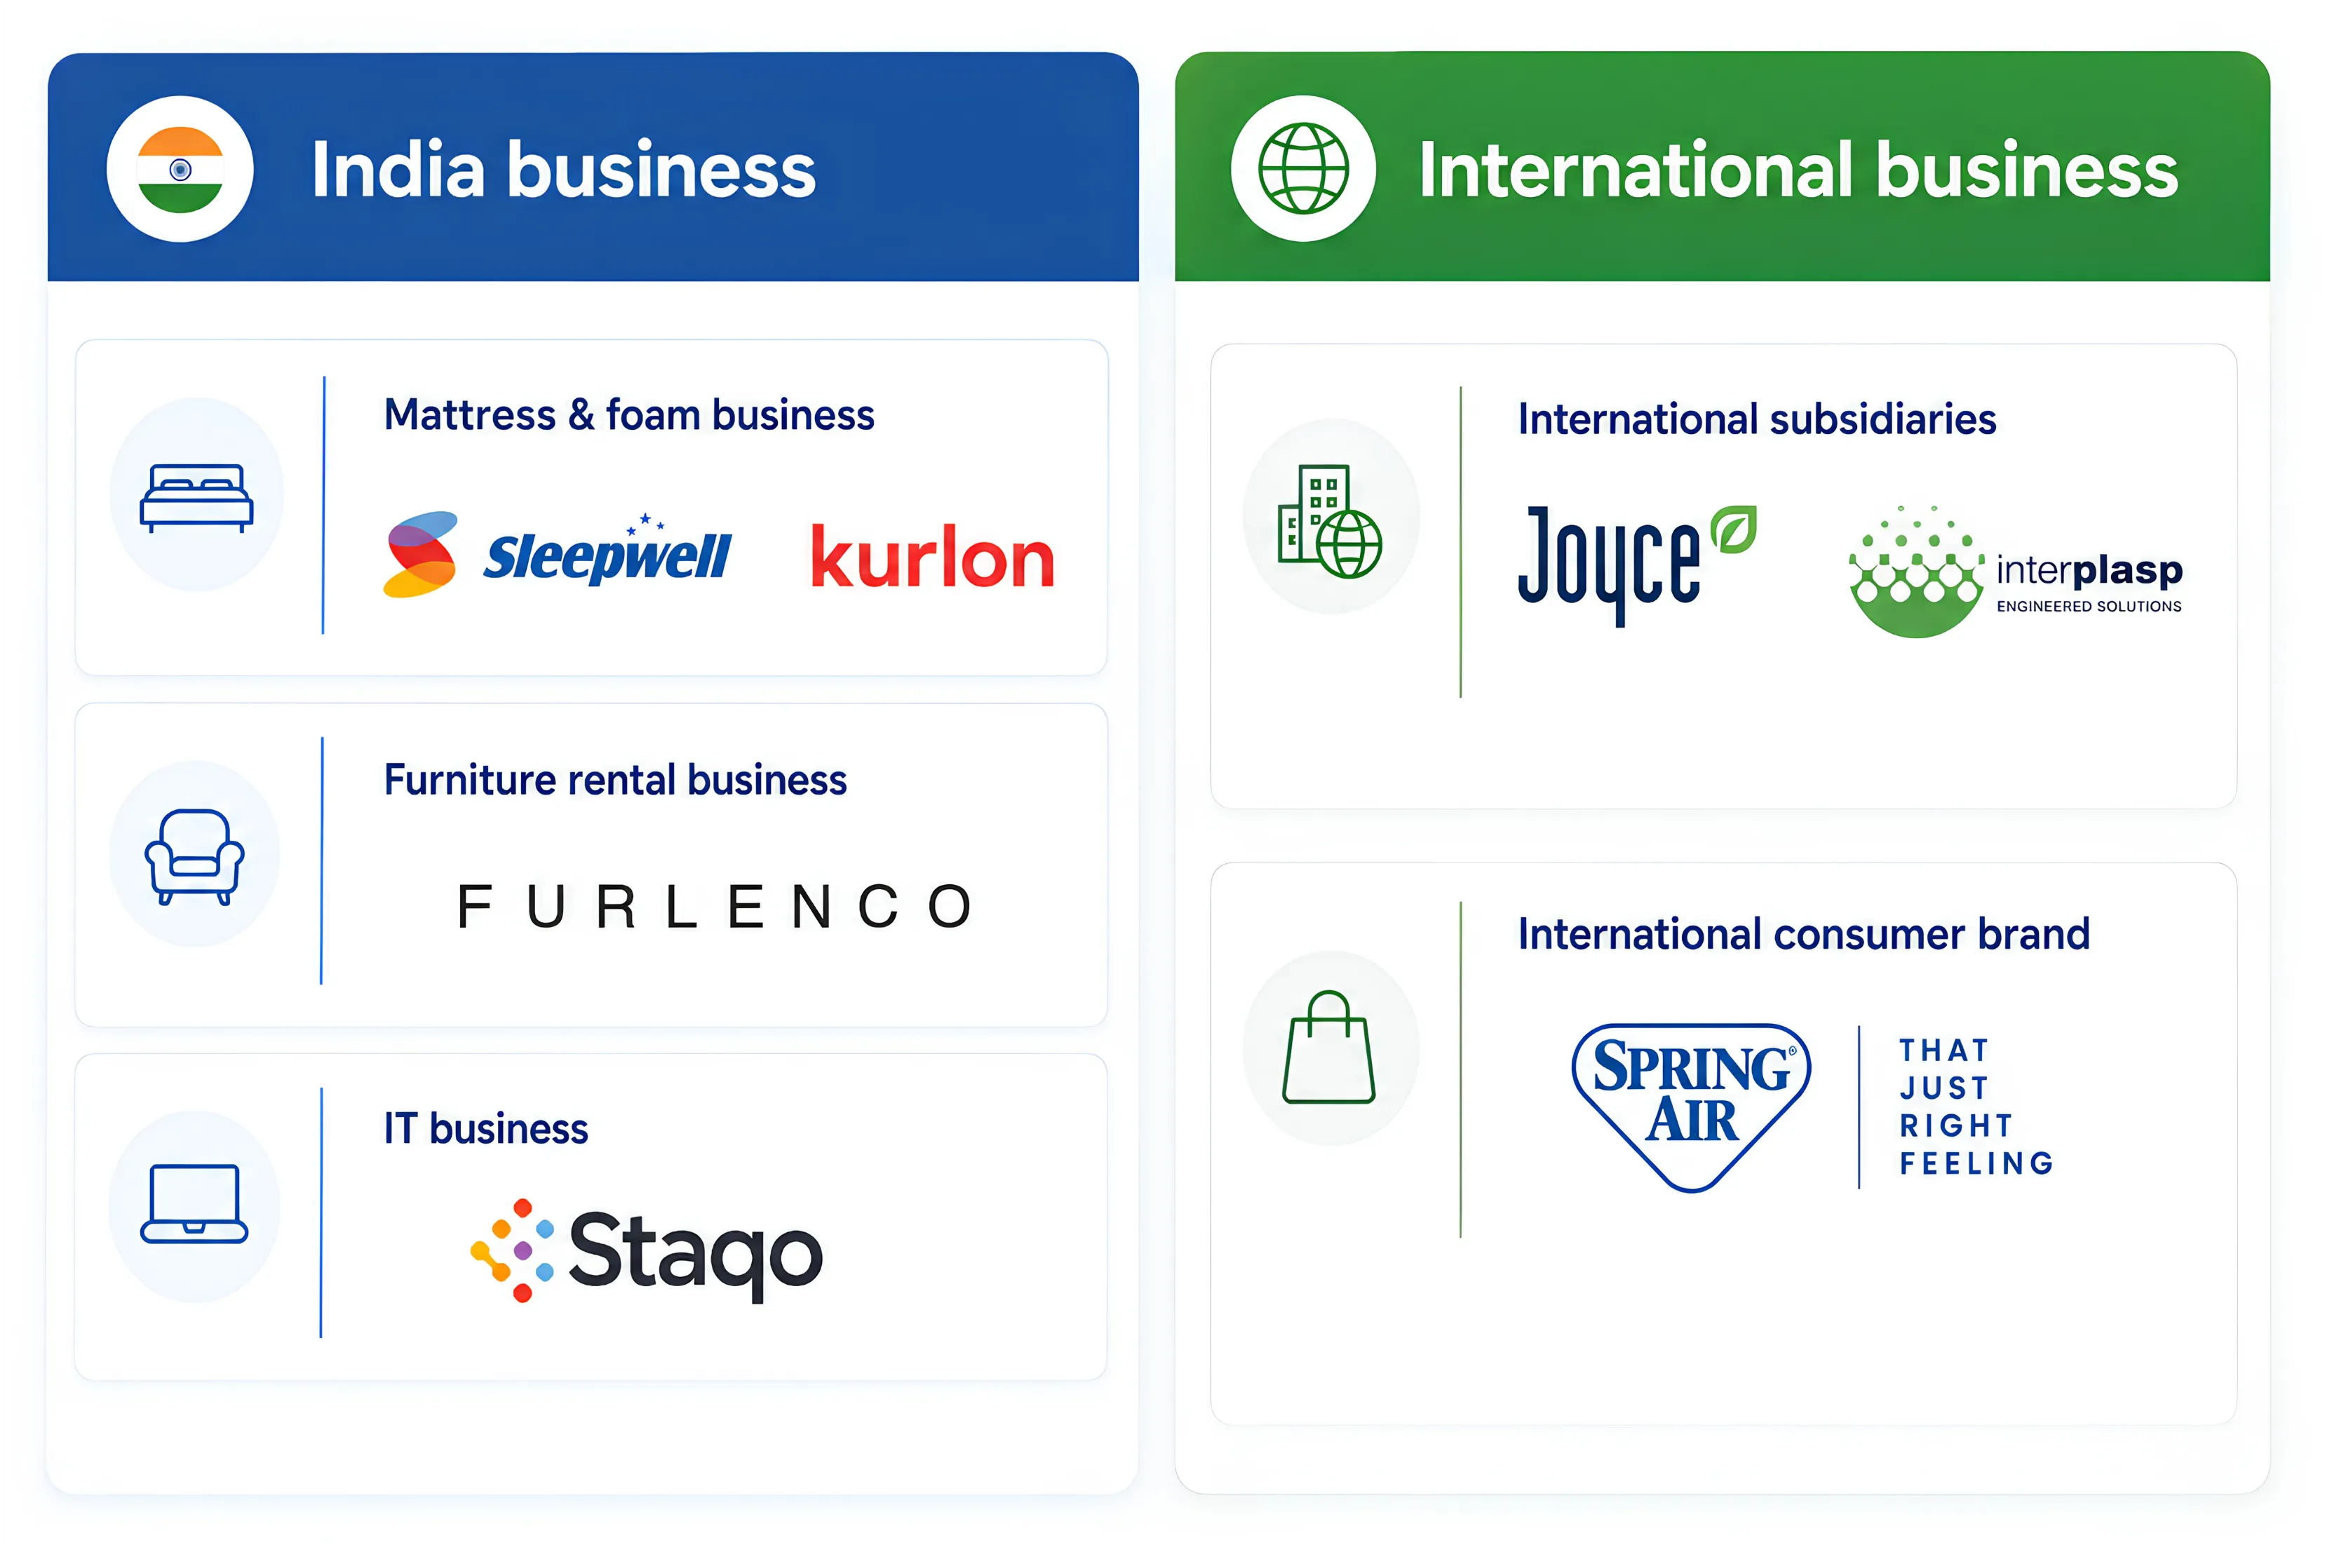
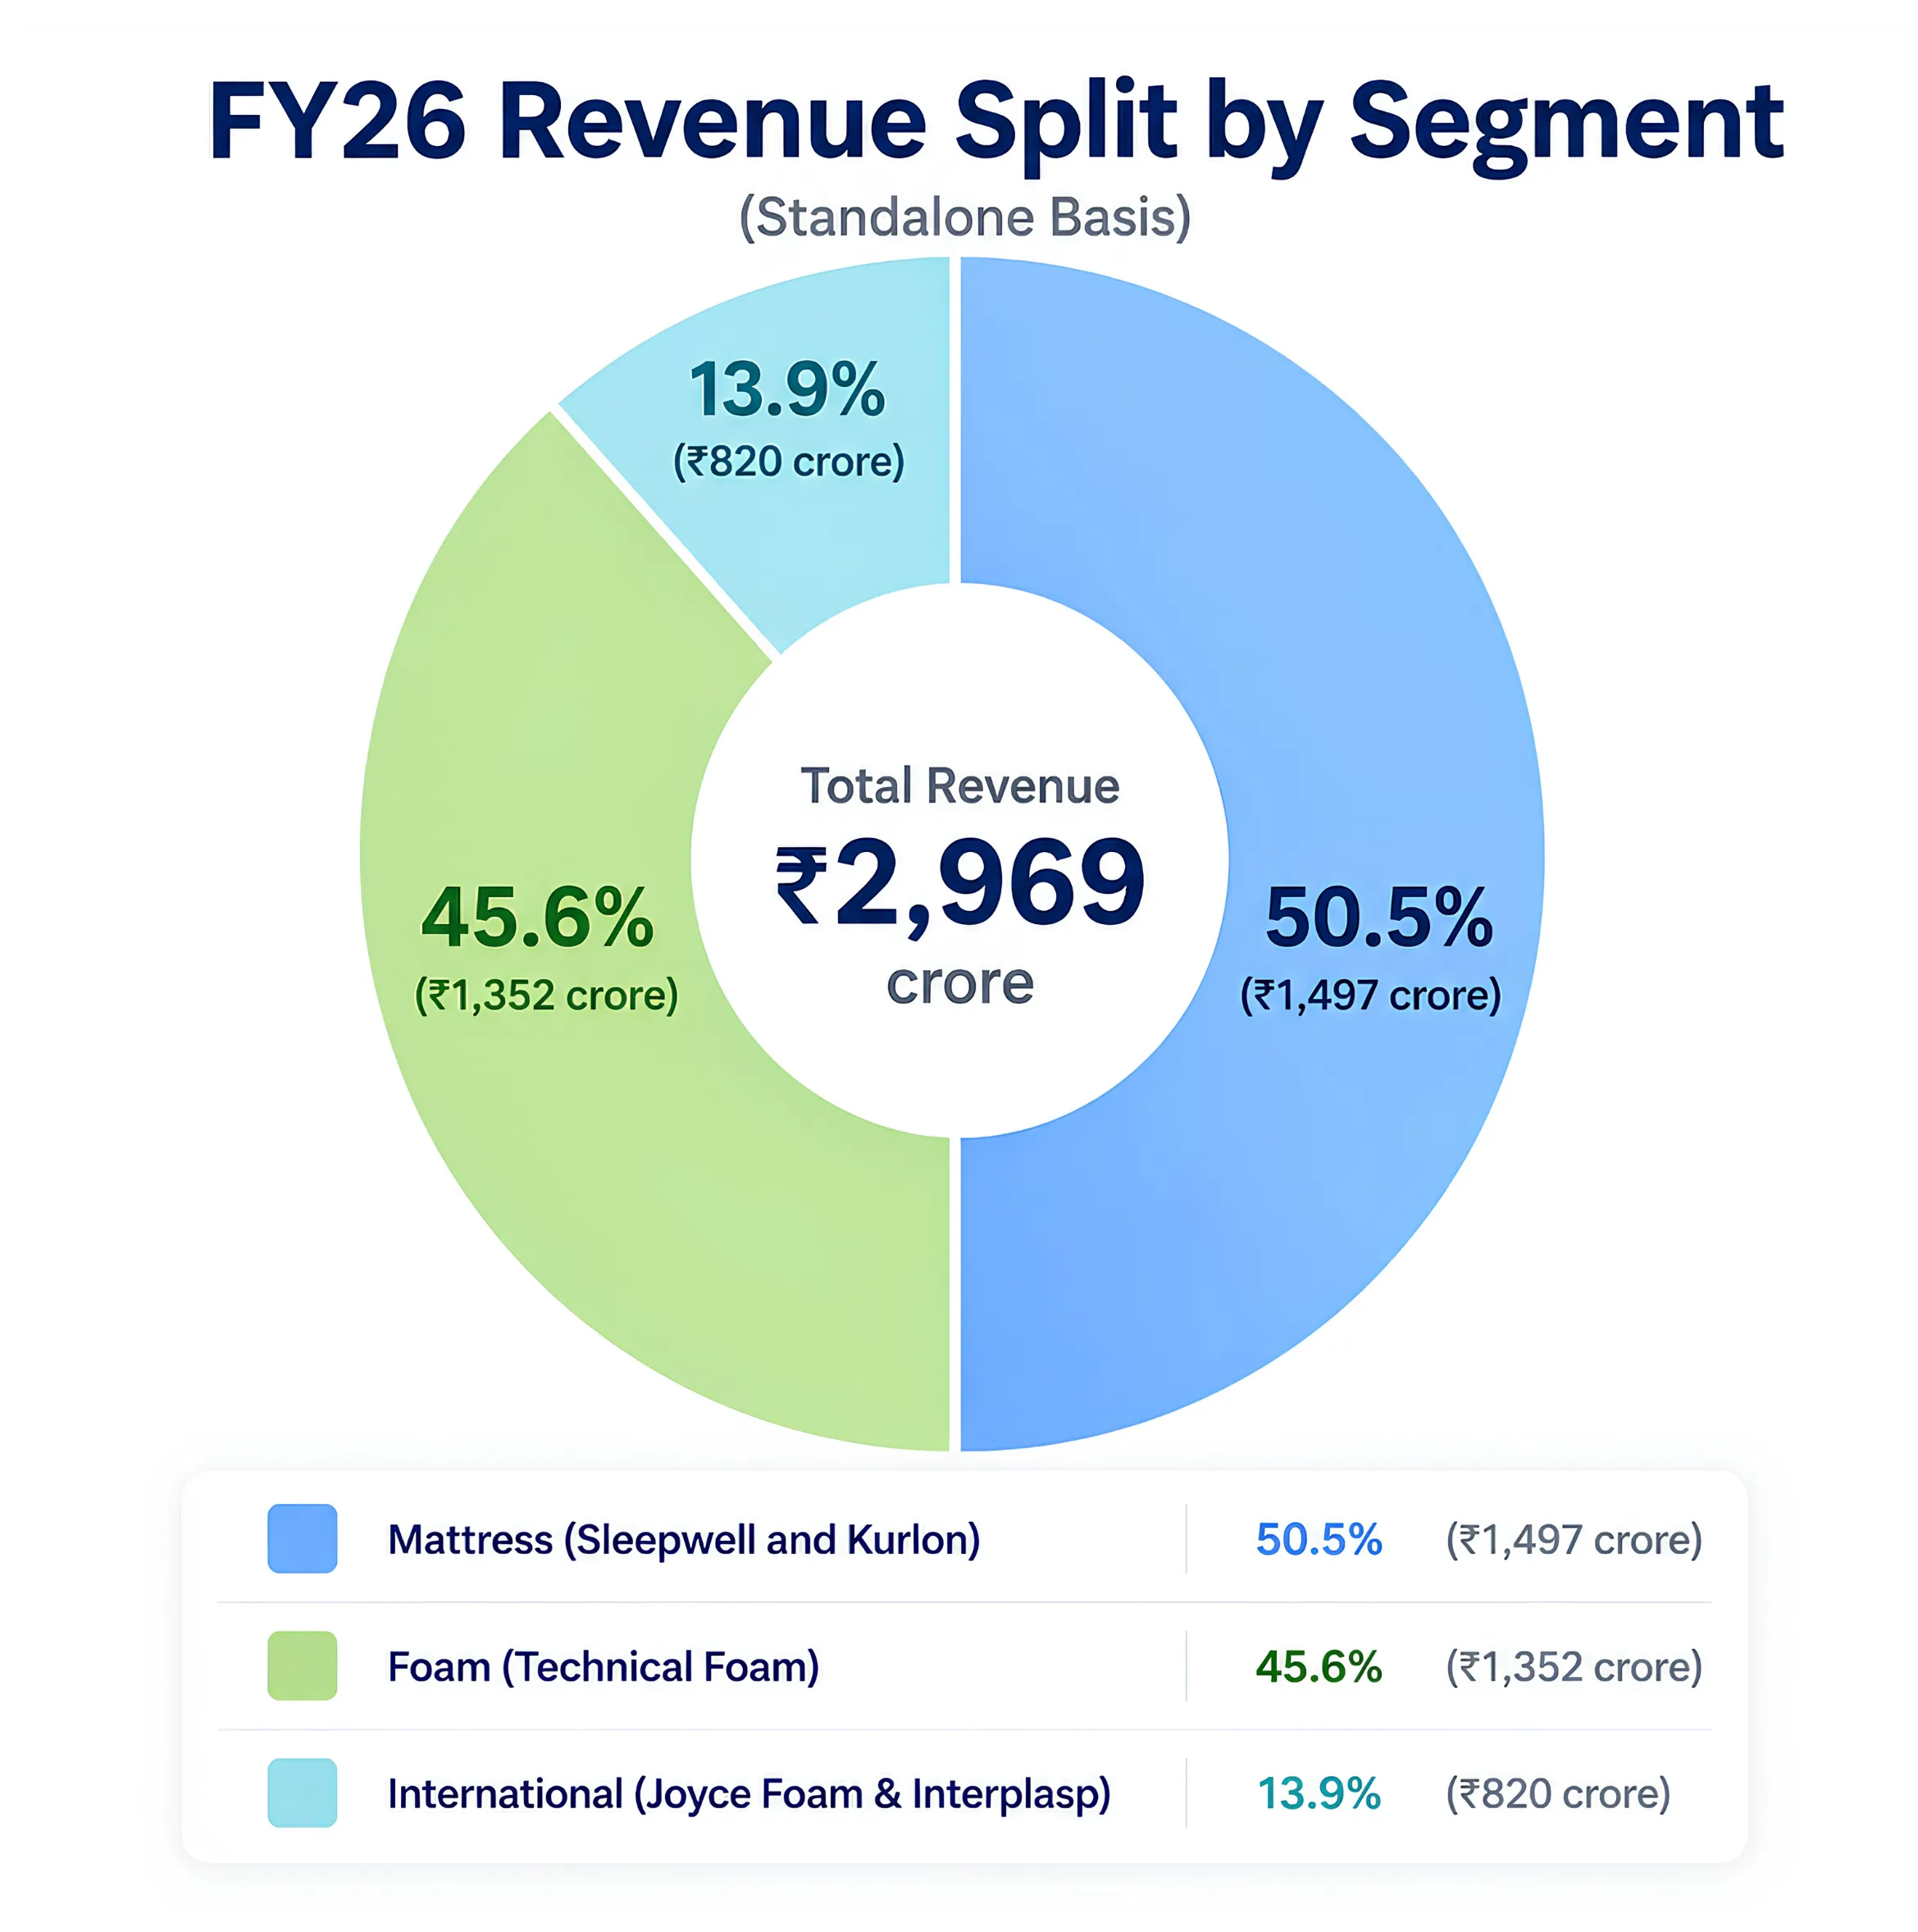
The business is divided into three operating segments. On a standalone basis in FY26, Mattress (Sleepwell and Kurlon brands combined) contributed Rs 1,497 crore, or 50.5% of standalone revenue, with 12% volume growth for the full year, Kurlon at 14% and Sleepwell at 10%. Foam, which covers technical foam sold to automotive, furniture, and packaging customers, contributed Rs 1,352 crore, or 45.6%, with volume growth of 18%. A small international business completes the picture: Joyce Foam in Australia, with Rs 422 crore revenue and a 10% EBITDA margin, and Interplasp in Spain, with Rs 391 crore revenue and a 10.4% EBITDA margin. Both subsidiaries were loss-making or barely breakeven in FY25 and delivered meaningful margin improvement in FY26 through pricing renegotiation with customers and supply chain restructuring.
The economic logic of the business is rooted in contribution margin. Raw materials, primarily polyol and TDI, constitute roughly 55-60% of revenue. When these inputs fall, margins expand quickly because Sheela's brand positioning gives it some ability to hold selling prices. When inputs rise sharply, as both did in FY26, moving 25-35% above their five-year averages, the ability to pass through cost increases is tested across three different channel types simultaneously: B2C branded mattresses, where pricing takes 10-15 days to adjust, B2B industrial foam, where contracts allow faster pass-through, and the U2O (unorganised-to-organised) channel, where lower price sensitivity demands careful calibration. Management noted in the Q4 FY26 concall that polyol peaked at Rs 220 per kg before settling to Rs 180, and TDI from GNFC, India's primary domestic supplier, stands at approximately Rs 275, both above their normalised levels.
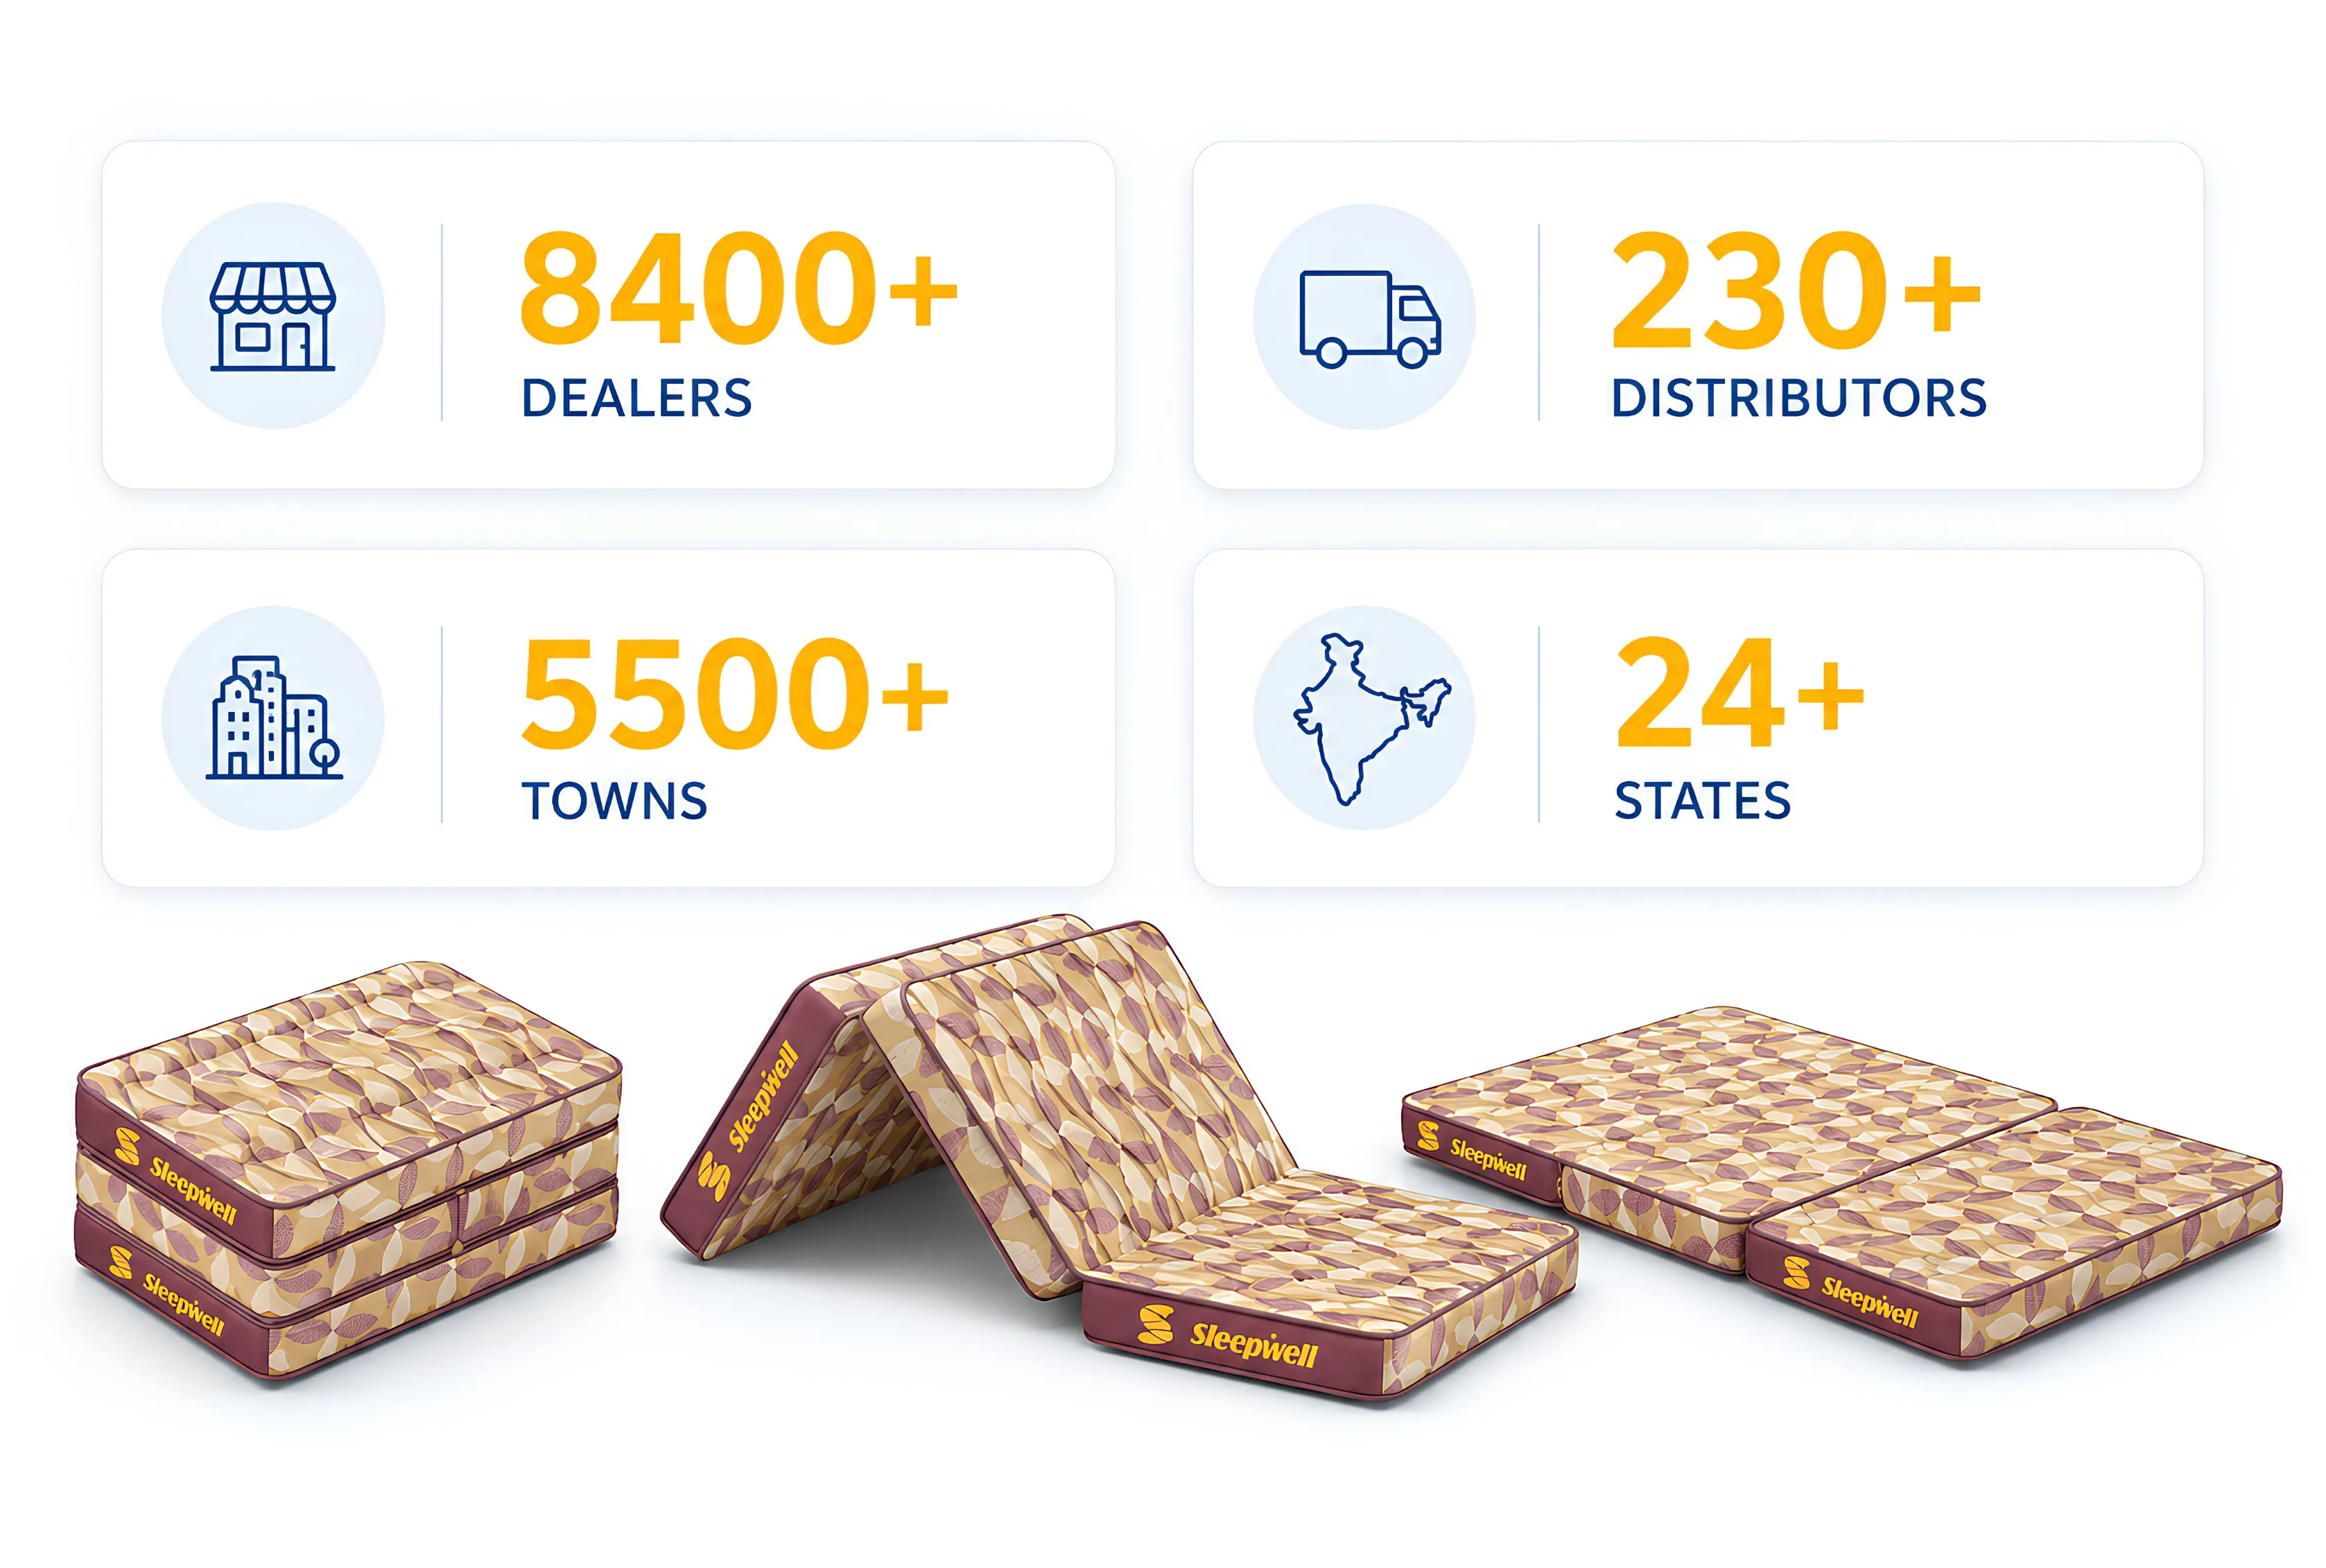
Sheela's Exclusive Branded Outlets, or EBOs, are stores that carry only Sleepwell or Kurlon products. The company does not own these stores; it recruits retail partners who invest in a dedicated showroom in exchange for exclusivity and brand support. The company added 600 net new showrooms in FY26, part of a broader distribution network of over 11,000 touch points spanning retail, online, and company-owned formats. The U2O programme, which targets towns where organised retail has no presence, now covers 8,400-plus dealers across 5,500-plus towns in 24 states.
Volume growth in this segment was 65% in FY26 and value growth was 111%, the gap reflecting both price increases and the introduction of a higher-priced second product into the channel. E-commerce sales on Sheela's own branded websites grew 136% year on year and sales on third-party platforms grew 39%.
For the entirety of its public life, Sheela Foam never paid a dividend. The board recommended its first-ever dividend in FY26, at 20% on face value of Rs 5, or Re 1 per share. This is a tangible signal of a structural shift in the cash generation profile: the company has moved from a phase of intensive capital absorption to one where surplus cash is available to return to shareholders. It also signals that management is not contemplating another large acquisition in the near term.
Financial Analysis: FY21 to FY26
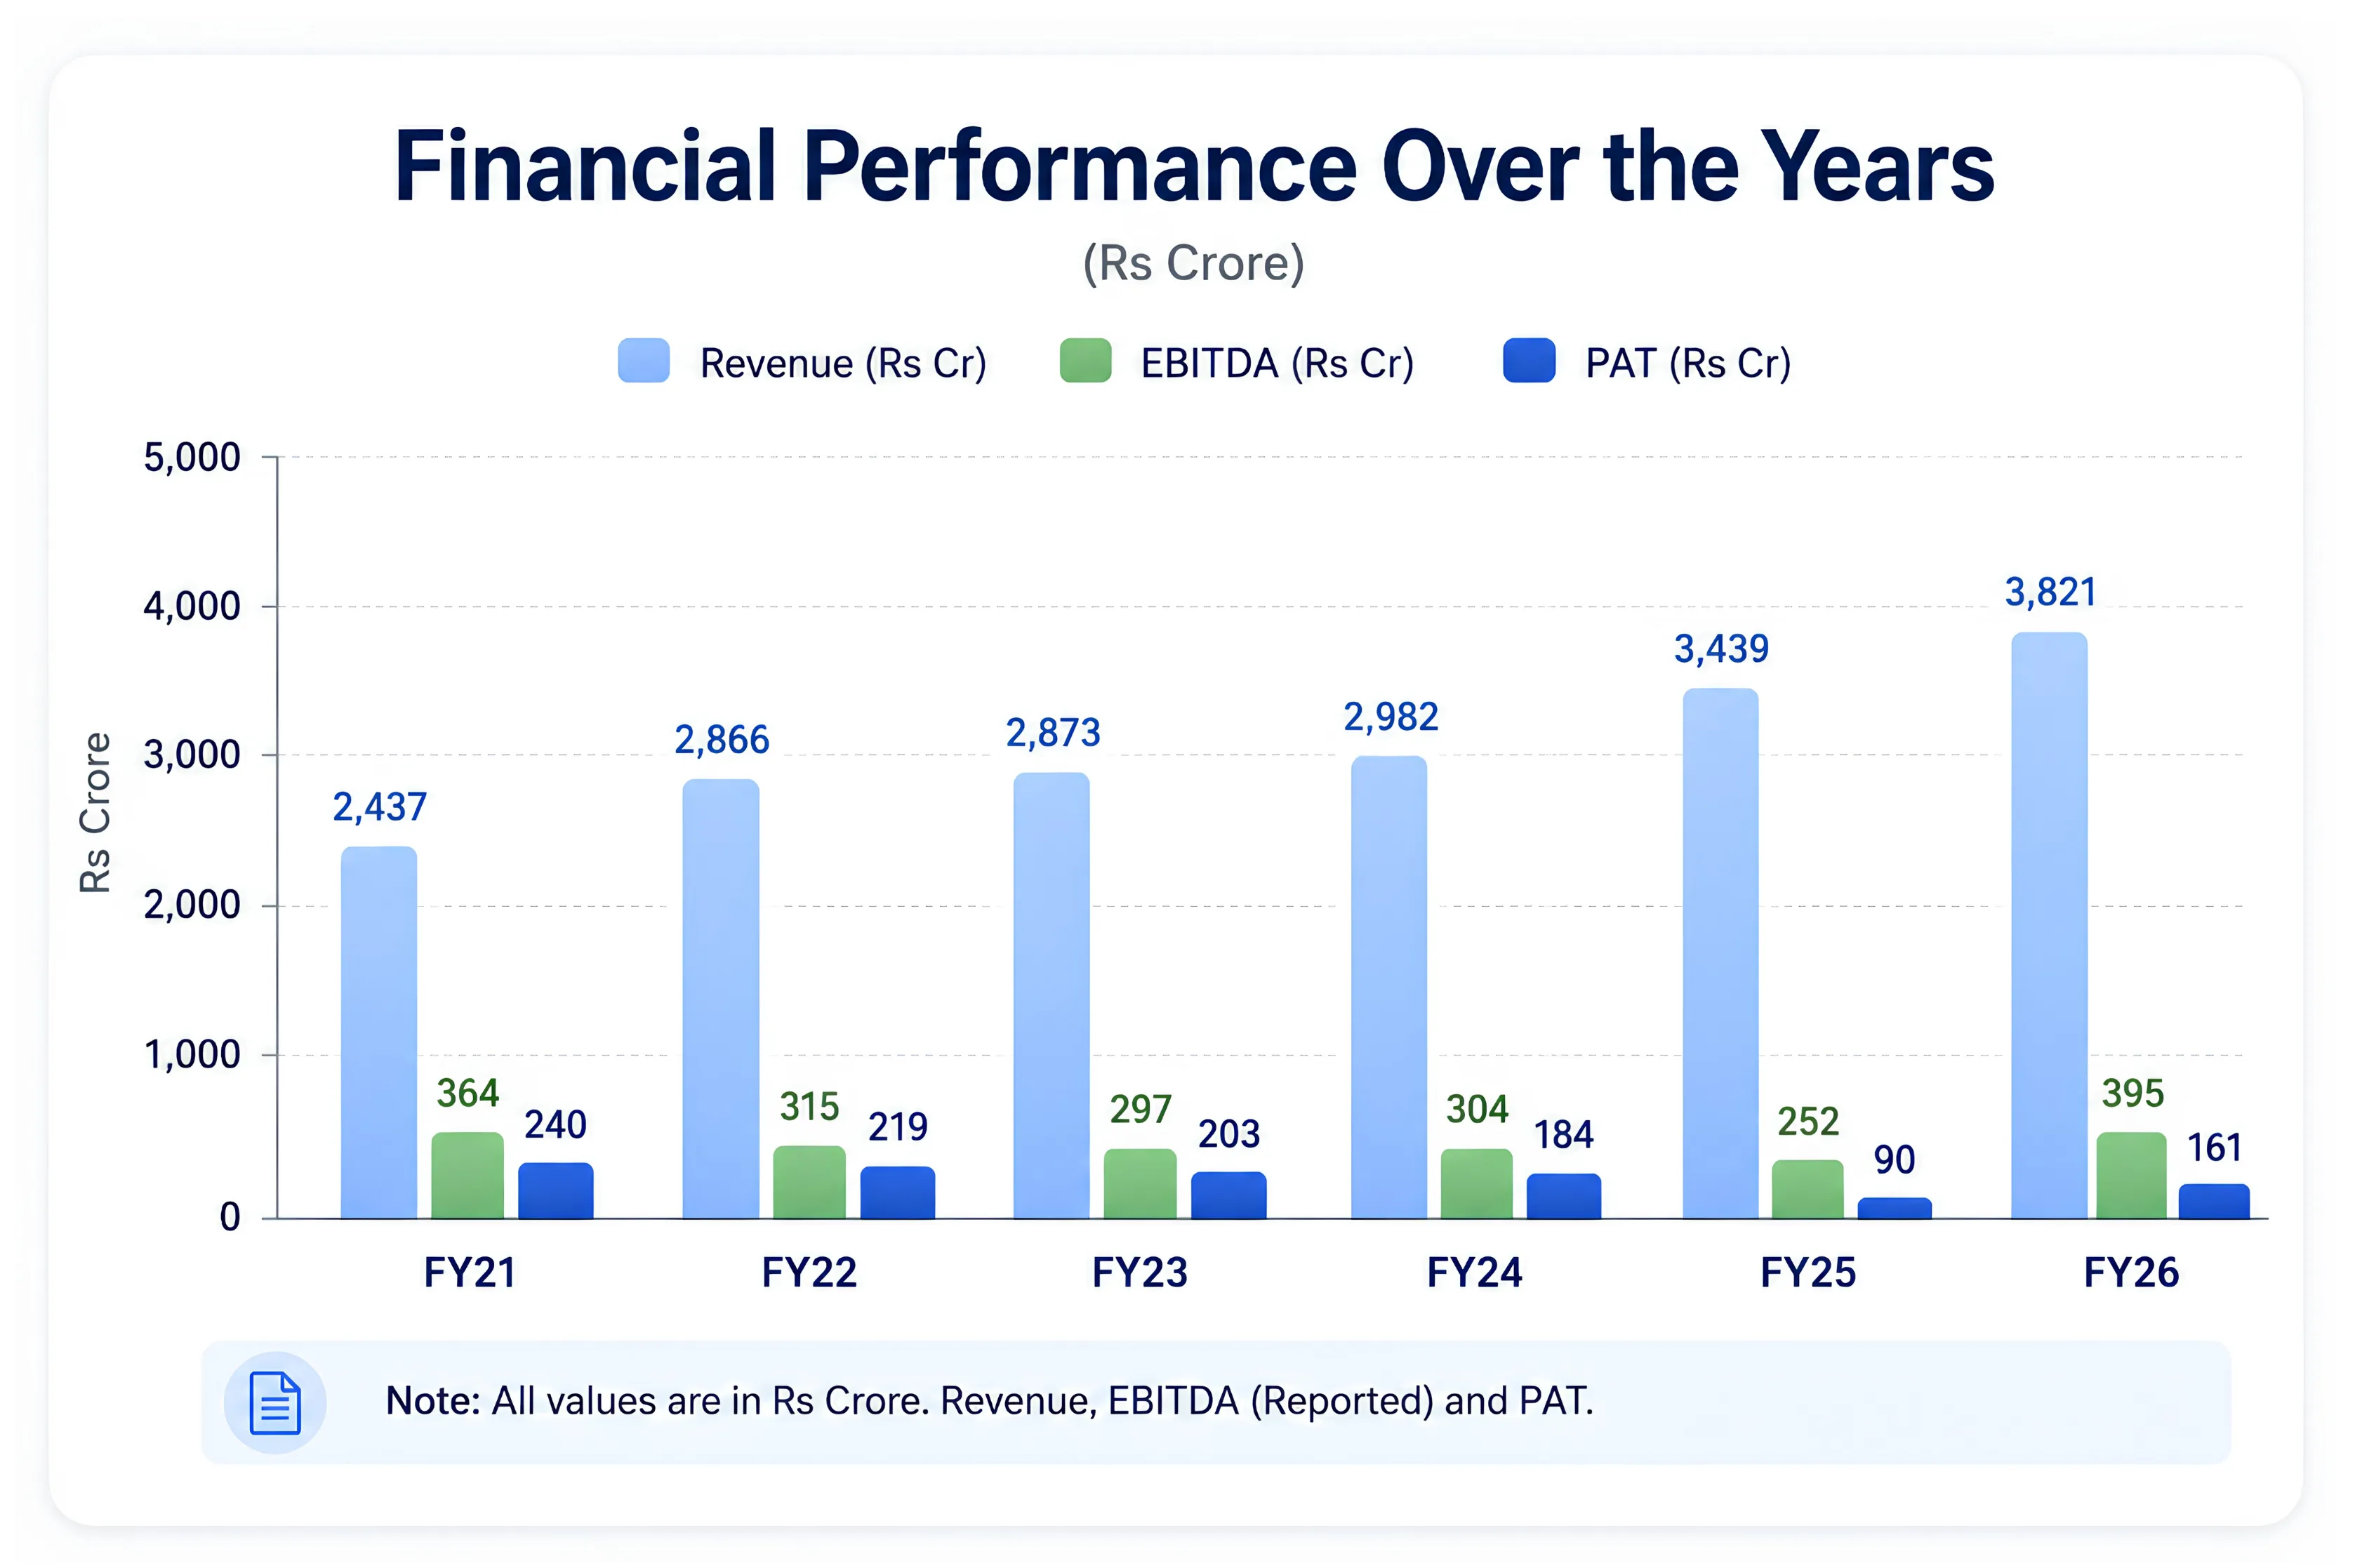
The revenue trajectory tells the story of a business that grew from Rs 2,437 crore in FY21 to Rs 3,821 crore in FY26, a five-year CAGR of approximately 9.4%. The growth was not linear. Revenue rose sharply into FY22 as the post-pandemic recovery drove housing-linked demand, then plateaued through FY23 and FY24 as the Kurlon integration consumed management attention. FY26 marks the resumption of momentum at 11% growth, with management targeting 15%-plus for FY27 given RM-driven price increases embedded into the sales base.
The EBITDA margin story is more instructive than the revenue line. Operating margins peaked at 15% in FY21, a period of benign raw material prices and strong volume recovery, then declined steadily through FY25, hitting 7% at the trough. The FY26 recovery to 10% on operating profit basis is what the market is watching. Q4 FY26 standalone core EBITDA margin was 11.5%, and consolidated core EBITDA for the full year crossed Rs 400 crore for the first time in the company's history. Management has guided the 11-12% band as the new structural norm once Kurlon integration is fully absorbed.
PAT shows the sharpest swings. At Rs 240 crore in FY21, it reflected a combination of benign input costs and strong volume. At Rs 90 crore in FY25, it reflected the full weight of Kurlon-related costs: higher depreciation, significantly higher finance costs (interest jumped from Rs 21 crore in FY23 to Rs 121 crore in FY25 as Rs 1,493 crore of acquisition debt was drawn), and Kurlon integration expenses. The FY26 recovery to Rs 161 crore, a 78% increase, was driven by EBITDA expansion, lower depreciation following a policy change from written-down-value to straight-line, and declining finance costs of Rs 95 crore versus Rs 121 crore in FY25. EPS of Rs 14.62 remains well below the Rs 22-24 range seen in FY21-FY23, and closing that gap is the core of the forward valuation story.
Balance Sheet
Before reading the balance sheet table, one explanatory note is essential. When Sheela acquired Kurlon, the consideration paid was higher than the tangible value of the assets acquired, something management explicitly acknowledged in the Q4 FY26 concall, noting that this is typical when buying a strong brand that delivers returns over a longer period. The excess was allocated to goodwill and brand intangibles, which is at Rs 1,612 crore on a consolidated basis. These intangibles sit on the balance sheet. Think of it this way: buying a house in a prime locality means paying a land premium that does not generate rental income directly, while the constructed structure does. The total investment looks expensive on a yield basis, but stripping out the land value reveals the true rental return on the constructed asset. Sheela's Cash ROCE, which excludes goodwill and brand intangibles from capital employed, stood at 18% in FY26, a very different picture from the reported 6%.
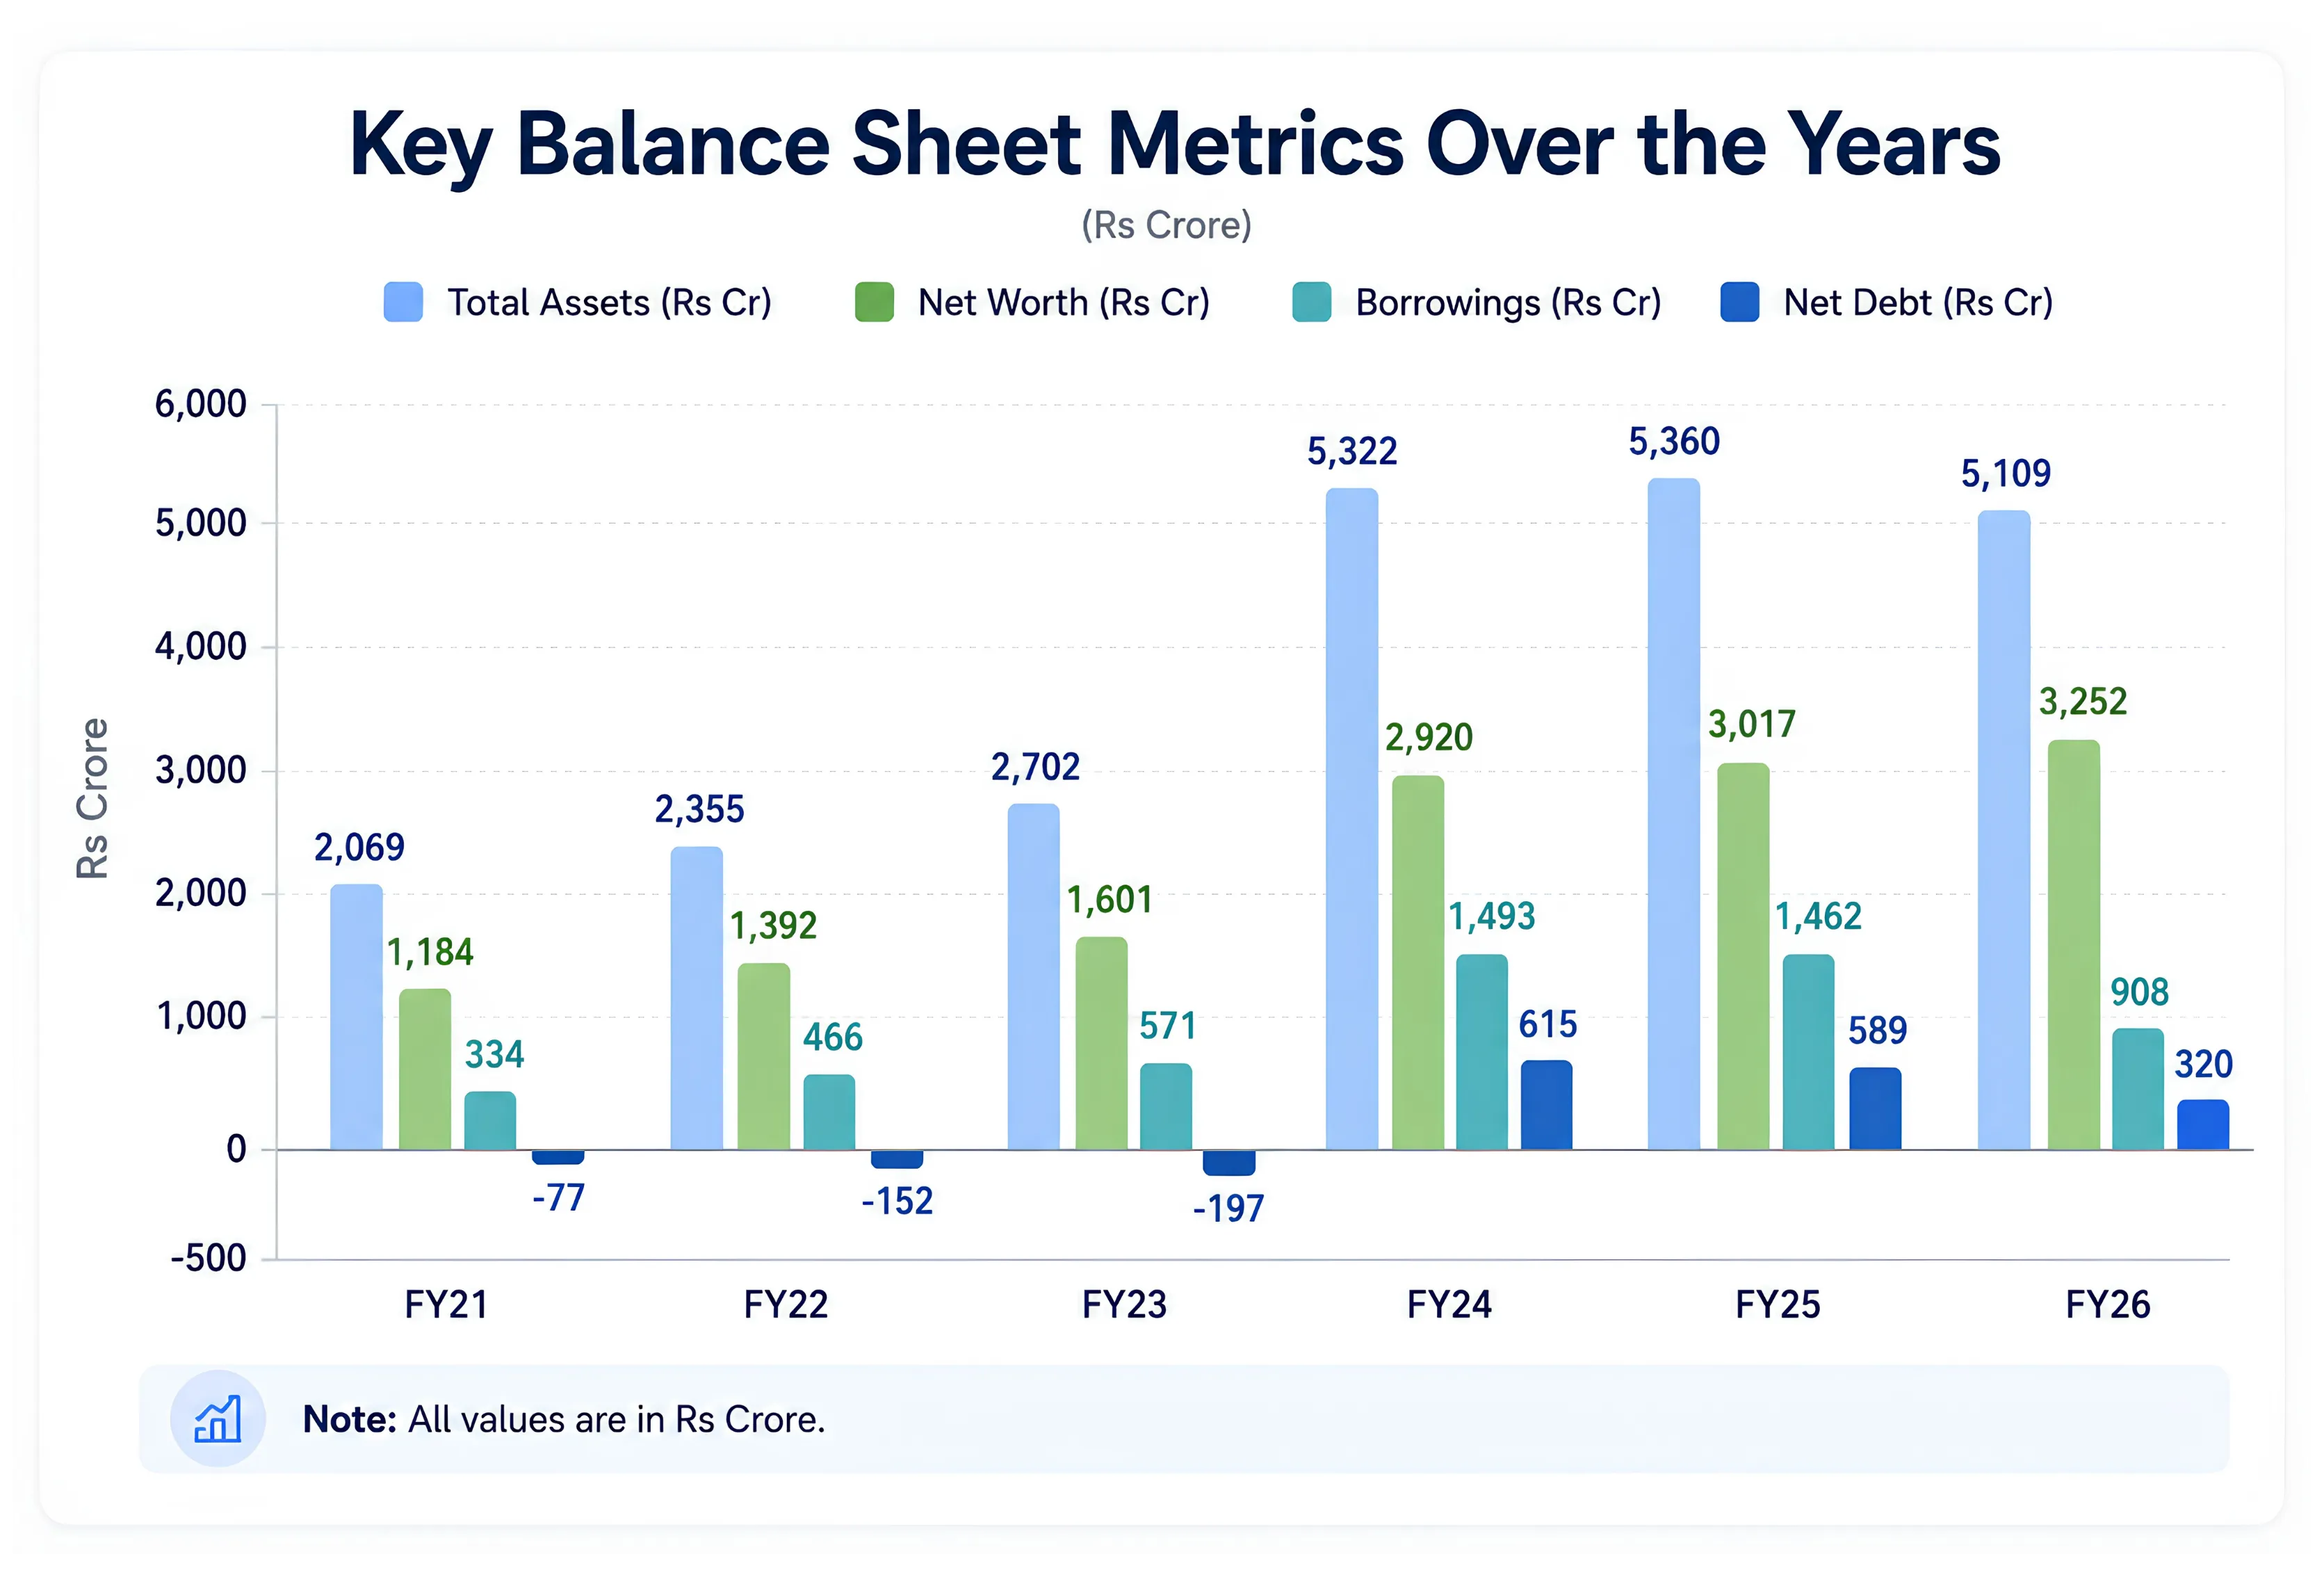
The balance sheet at the start of this period, FY21, already shows a business with very limited leverage relative to where it would end up. Borrowings stood at Rs 334 crore and ROCE was 23%, well above the 14% it would fall to by FY23. Net Worth grew steadily from retained profits without requiring equity dilution through this stretch.
The FY24 step-change is entirely attributable to Kurlon. Total assets jumped from Rs 2,702 crore to Rs 5,322 crore. Borrowings jumped from Rs 571 crore to Rs 1,493 crore. ROCE fell to 8%. These are not operational failures; they are the mechanical consequences of a large brand acquisition. The question is how quickly the balance sheet can normalise. Borrowings have already come down to Rs 908 crore in FY26, a reduction of Rs 554 crore in two years. Management has guided total debt toward Rs 600-700 crore, with approximately Rs 350 crore in international entities that are self-liquidating from local cash flows, and Rs 300 crore in India, potentially fully repayable within 18 months from Indian operating cash flows.
Cash Flow
The cash flow data contains the most important story in the entire financial history of this company. Read the investing row for FY24: a Rs 2,258 crore outflow. That is the Kurlon acquisition. The operating business generated Rs 406 crore in the same year, consistent with its historical rate, but the investing outflow wiped out four years of operating cash generation in a single year. Free cash flow was negative Rs 1,870 crore in FY24.
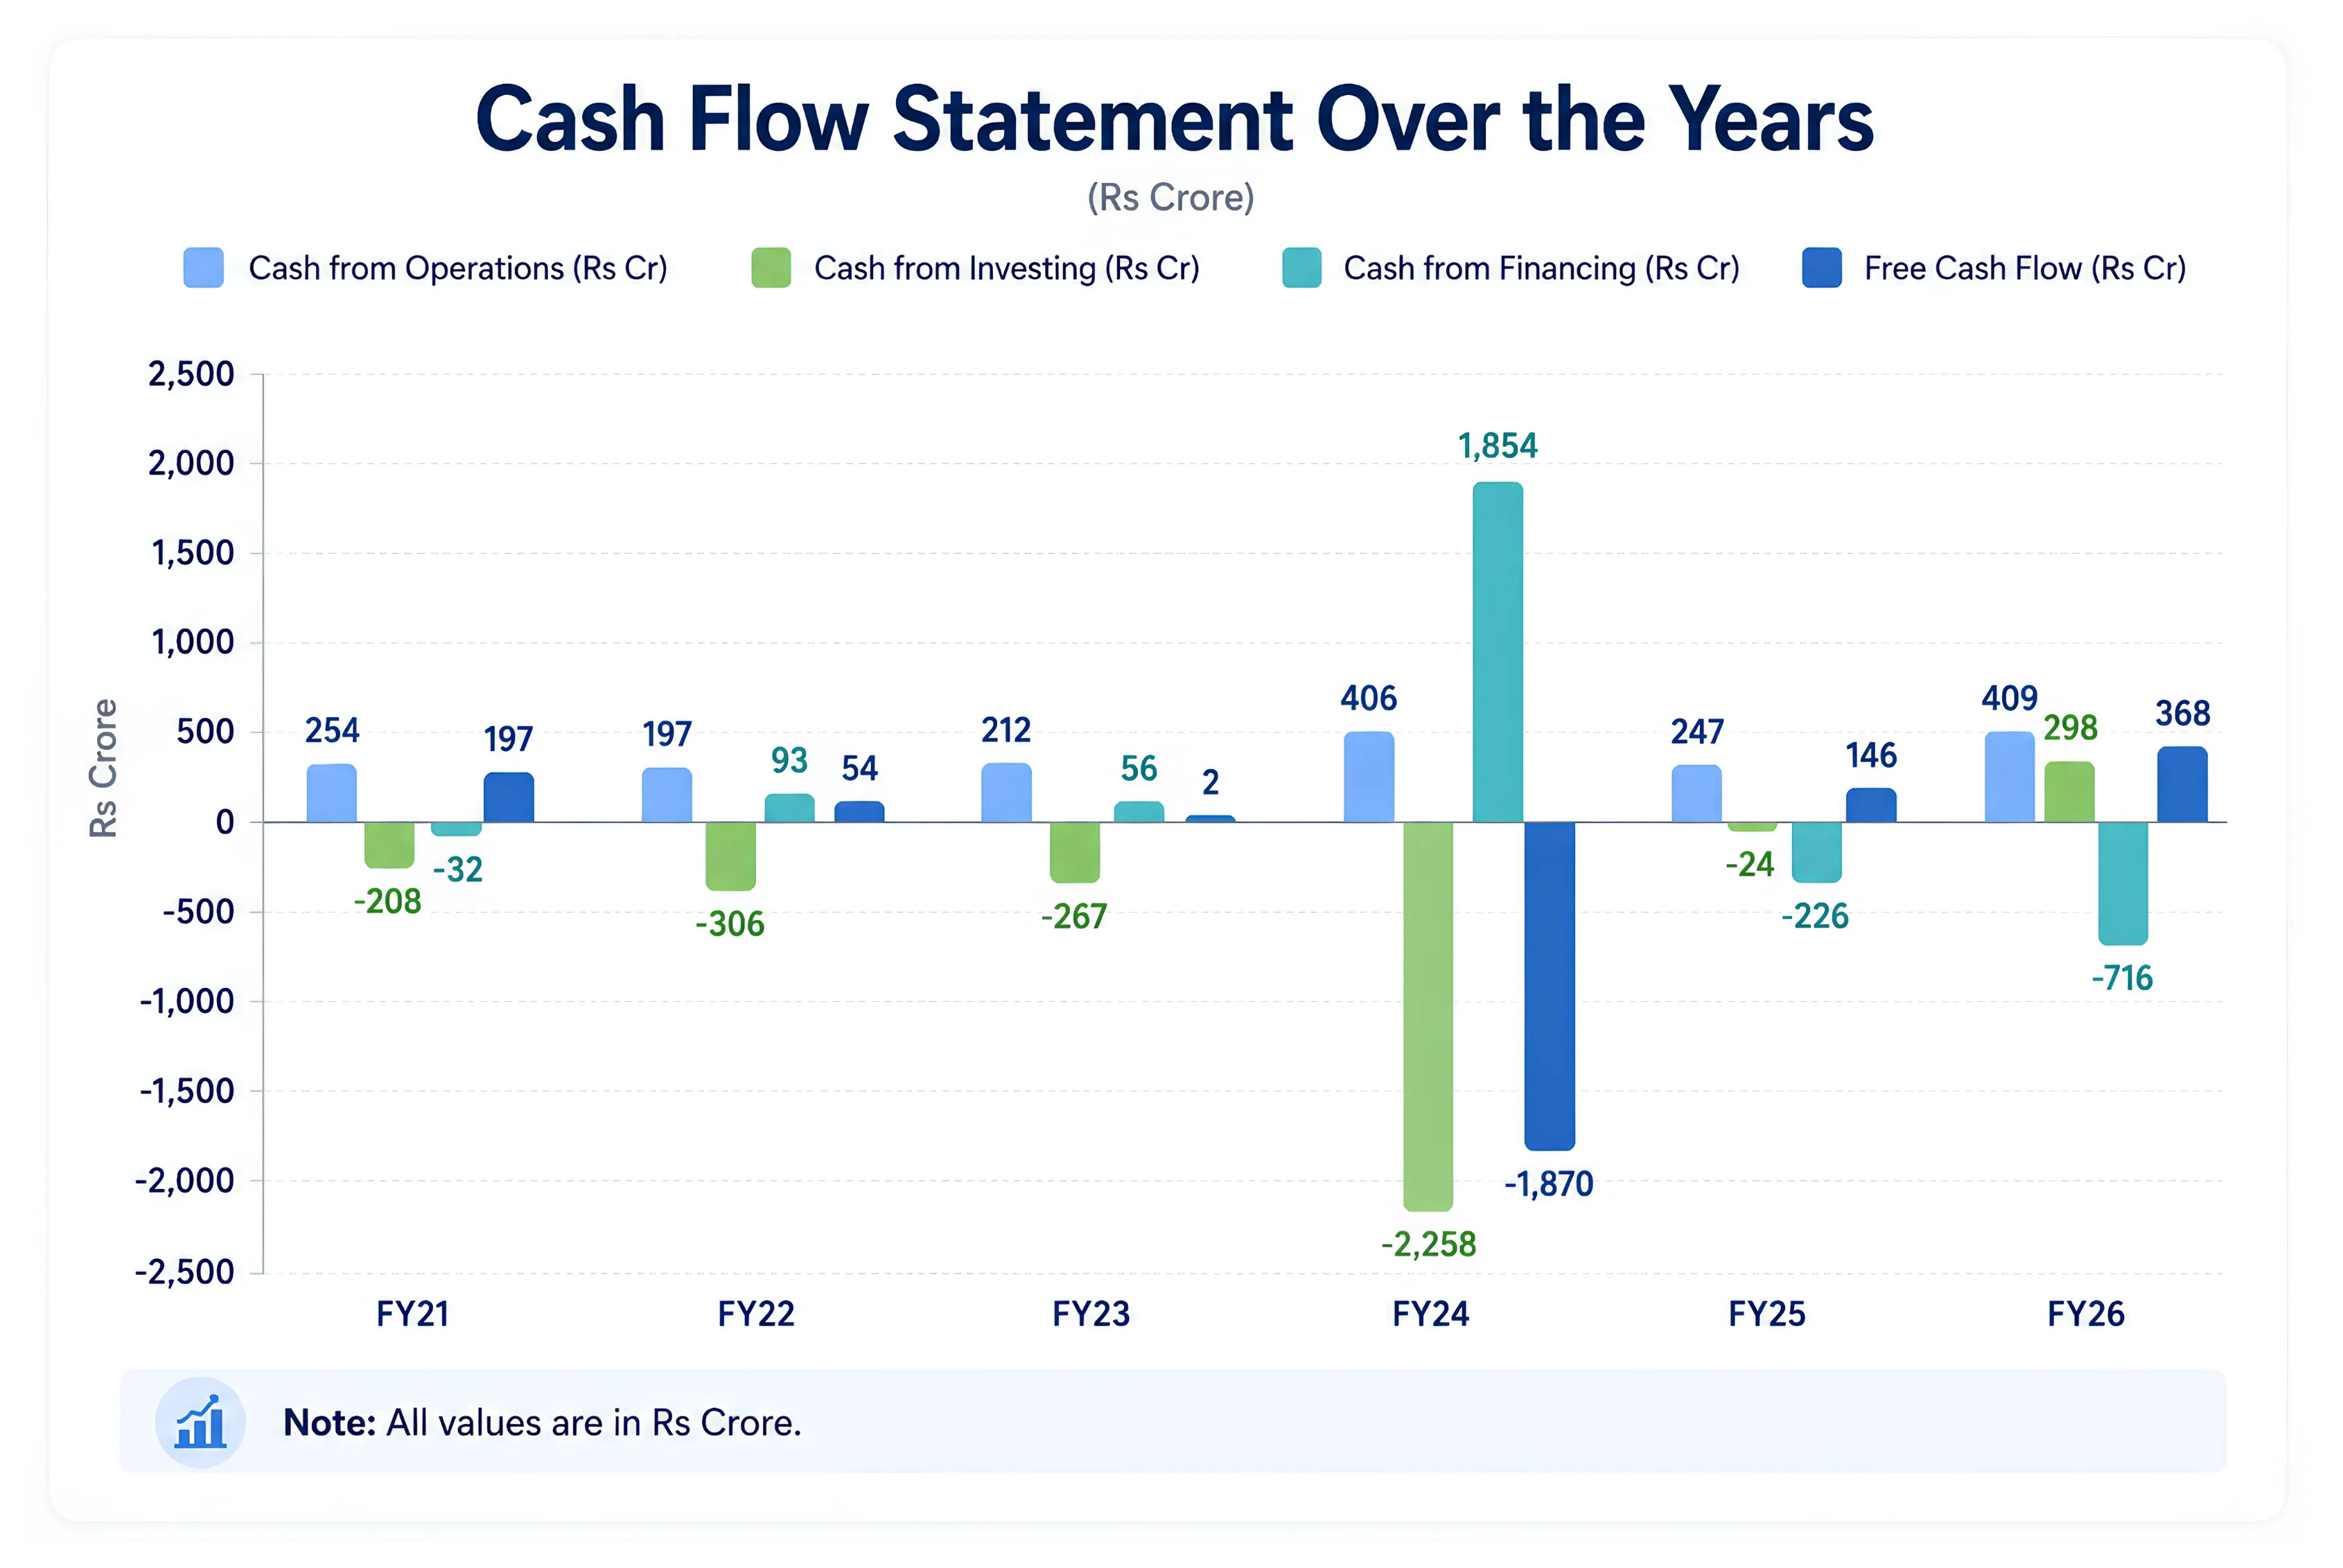
The recovery from FY24 has been remarkably swift. Operating cash flow in FY26 at Rs 409 crore is the highest in the company's history, exceeding even the FY24 figure of Rs 406 crore. Capital expenditure has normalised sharply, falling to Rs 41 crore in FY26 from Rs 129 crore in FY24, as the major capacity additions preceding the acquisition are complete and Kurlon's manufacturing footprint absorbs Sheela's overflow without new investment. Free cash flow at Rs 368 crore in FY26 is the second-highest ever, after FY21's Rs 191 crore.
One working capital metric deserves attention. Working capital days stood at negative 51 in FY26. Negative working capital means the company collects cash from customers before it pays suppliers, a characteristic of businesses with strong brands and loyal dealer ecosystems. Sleepwell's EBO dealers pay on short credit terms while raw material suppliers extend standard credit. At Rs 3,821 crore of revenue, negative working capital of 51 days represents roughly Rs 530 crore of implicit financing from the supply chain. As the company grows, it generates additional cash from this structural dynamic without additional capital.
Also Read: A Fundamental Look At TVS Supply Chain's Turnaround
Industry Tailwinds: Converting the Unorganised
The Indian mattress market was valued at approximately USD 2.31 billion in FY25 and is projected to reach approximately USD 3.48 billion by FY30. The industry remains significantly influenced by unorganised players competing primarily on price, a dynamic that pressures margins for organised manufacturers and limits differentiation, though the precise scale of the unorganised segment is not separately quantified in available company disclosures. Sheela holds approximately 30% of the branded organised segment in India and approximately 40% in Australia. The conversion from unorganised to organised remains the secular growth driver.
Four forces are accelerating this conversion. GST consolidation narrowed the cost advantage that unregistered manufacturers previously enjoyed through tax arbitrage. Urbanisation and housing completions drive new mattress purchases, since every residential unit handed over is a potential Sleepwell or Kurlon sale. Premiumisation is pulling the Rs 5,000-15,000 segment ahead of the overall market as consumer aspirations rise. And specific to Sheela, the U2O distribution initiative seeds organised retail in towns where it previously did not exist. The 65% volume growth and 111% value growth in this channel in FY26 are evidence that active seeding is working faster than passive conversion alone.
The tailwind is real and long-dated, but Sheela is no longer a small company finding its footing in this wave. With 30% of the organised market already, meaningful incremental share gains will require continued brand investment and distribution expansion against increasingly well-funded competitors, including Duroflex and Wakefit.
Competitive Advantages
The dual-brand architecture is Sheela's most difficult-to-replicate advantage. Sleepwell commands strong recall in north and central India; Kurlon holds equivalent or stronger recall in south and west India. Together, they give Sheela a meaningful presence in every major regional market simultaneously, a breadth no listed competitor matches at comparable brand equity. Duroflex, the next strongest branded competitor, holds approximately 8% of the branded market against Sheela's combined 30%-plus.
Negative working capital is a structural cash machine. As discussed in the financial section, working capital days of negative 51 in FY26 mean the company is financed by its supply chain and dealer network to the tune of approximately Rs 530 crore at current revenue. As Sheela grows, this financing source grows proportionally. A new mattress company or a D2C challenger must pre-fund inventory; Sheela does not.
Manufacturing scale gives procurement leverage. Sheela operates 12 manufacturing units with total production capacity of approximately 1,39,000 metric tonnes per annum, alongside its international operations in Australia and Spain. At this scale, it negotiates volume discounts with polyol and TDI suppliers, accesses longer credit terms, and builds strategic inventory buffers ahead of known seasonal demand spikes. When GNFC faced temporary shutdowns in March 2026 due to natural gas disruption, Sheela serviced customers without stockouts by drawing on buffer inventory and alternative suppliers from Korea and China, something a smaller competitor could not have managed.
The foam business, technical and comfort foam sold to industrial clients, also acts as a revenue stabiliser. It generated Rs 1,352 crore in FY26 with 18% volume growth, requires no consumer marketing spend, and operates on contract-based pricing, providing a partial hedge against seasonal softness in retail mattress demand. Foam volume grew 34% in Q4 FY26, with some of that growth coming from smaller competitors who lost supply chain access during the Middle East-driven TDI disruption, business that Sheela retained through relationship continuity.
Growth Drivers: The Next Three to Five Years
The primary growth driver is margin recovery through Kurlon integration maturation. Management has guided consolidated core EBITDA margin to 11-12%. At FY27E revenue of approximately Rs 4,200 crore, a 10% increase from FY26, each 100 basis points of margin improvement above 10.5% adds approximately Rs 42 crore to EBITDA. The path from 10.8% to 12% is achievable if RM prices normalise toward five-year averages and integration efficiency continues improving. The synergy target of Rs 250 crore total stood at approximately Rs 190-200 crore by early FY27, with the final Rs 40-50 crore contingent on installation of new malleable-fibre comfort machines, which management indicated would be operational by mid-Q1 FY27.
The second driver is showroom expansion. Sheela added 600 net new showrooms in FY26 and intends to match or exceed that pace in FY27, extending the company's distribution footprint within an existing network of over 11,000 touch points. Each new EBO is capital-light for the company, since the dealer funds the store while Sheela provides inventory and brand support. Kurlon's expansion into northern India, where it had limited presence before the acquisition, was an area of encouraging traction per management's Q4 commentary.
The third driver is the U2O programme, already covering 8,400 dealers in 5,500 towns with 65% volume growth in FY26. The pillow segment, historically given away free with mattress purchases, is now being developed as a standalone revenue category that management estimates at approximately Rs 100 crore.
The fourth driver is e-commerce grew 136% year on year and platforms grew 39% in FY26. Management acknowledged that Kurlon was underperforming on platforms before the integration and that improvements in online portfolio alignment and pricing drove the recovery.
A fifth drive is the optionality around international business. Management confirmed in the Q4 FY26 concall that they remain open to selling Australia and Spain at the right price, which would release capital to retire the India debt faster and re-rate the balance sheet materially. The valuation mechanics are discussed in the FAQ section below.
Peer Comparison
A candid note before the table: there is no genuinely comparable listed peer for Sheela Foam in the Indian public markets. The two closest competitors by business model and brand scale are not publicly available for comparison. Duroflex, with approximately 8% branded mattress market share, and Centuary Mattresses, unlisted with approximately Rs 274 crore revenue, are both excluded for this reason. The three companies shown below are the best proxies available from the listed universe, but each carries a qualification. Responsive Industries derives the bulk of its revenue from PVC-based products such as vinyl flooring and synthetic leather, not branded mattresses. Wakefit Innovations is a recently listed D2C brand with a volatile profitability history. Euro Pratik Sales is an asset-light distributor of decorative wall panels and laminates rather than a manufacturer-marketer of mattresses, and at Rs 335 crore revenue its scale is a small fraction of Sheela's.
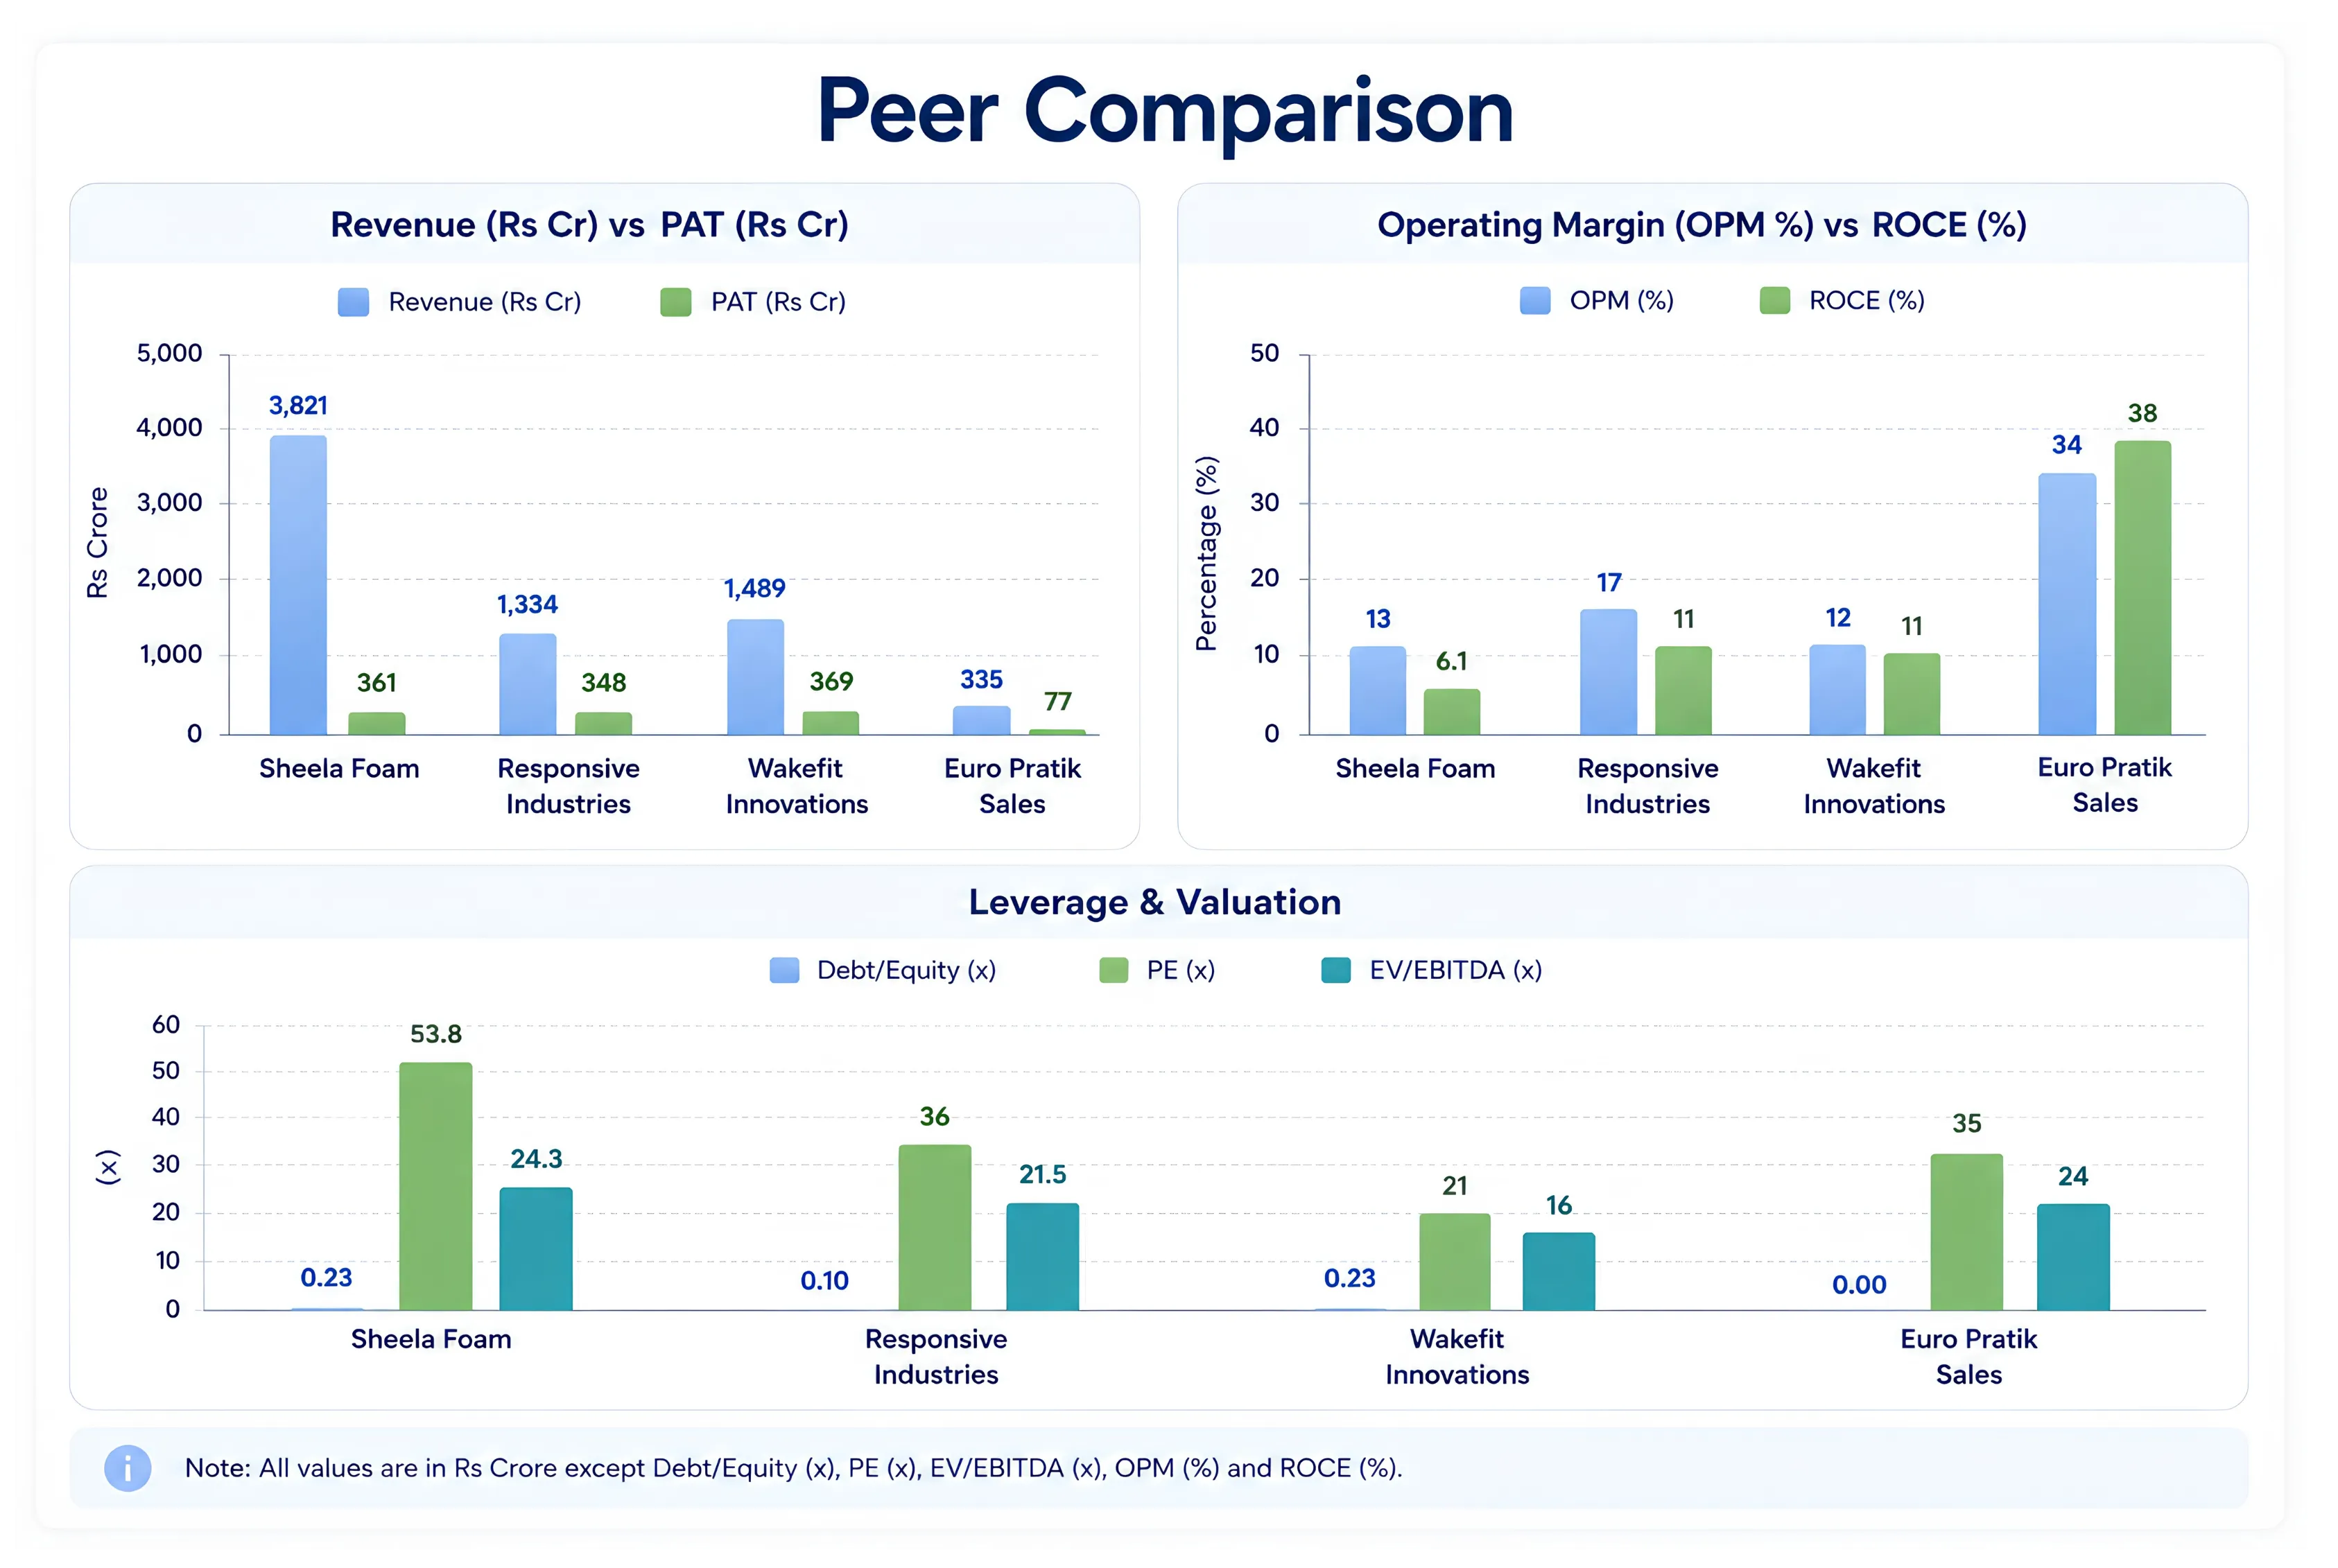
Sheela's ROCE of 6.1% is depressed by the Kurlon acquisition intangibles, as discussed in the financial section; its Cash ROCE of 18% is more reflective of underlying capital productivity. On operating margin, Sheela's 10.4% sits well below all three peers shown here, Responsive Industries at 17.3%, Wakefit at 12.2%, and Euro Pratik Sales at 33.8%, though each operates a structurally different business with different cost and asset intensity,
so the margin gap is not a like-for-like signal of competitive weakness. Euro Pratik in particular is a fraction of Sheela's scale, with revenue of Rs 335 crore against Sheela's Rs 3,821 crore, an asset-light distributor model that explains both its high margin and its high ROCE. The PE of 54.2x at the current market price prices in a recovery story; the forward PE on FY27E base case earnings of approximately Rs 207 crore would be approximately 39x, still a meaningful premium that assumes the margin trajectory holds.
Key Risks
| Risk | Severity | Trigger | Financial Impact |
|---|---|---|---|
| Raw material spike (polyol and TDI) | HIGH | Middle East supply disruption continues; GNFC (India's only TDI producer) faces further shutdowns; crude oil spike. | Polyol at Rs 220 peak in FY26, now at Rs 180. Each 10% sustained increase above five-year average of Rs 120 (polyol) and Rs 240 (TDI) that cannot be passed through compresses EBITDA margin by ~100 bps. |
| Kurlon integration drag and brand conflict | HIGH | Channel overlap between Sleepwell and Kurlon dealers in geographies where both brands compete; Kurlon dealers defect to competitors. | Rs 1,612 crore of goodwill and brand intangibles on the consolidated balance sheet from the Kurlon acquisition. If Kurlon revenue stalls, ROCE recovery stalls, making the acquisition price harder to justify. Management acknowledged integration struggle for the first two years. |
| Consumer spending slowdown | MEDIUM | Urban housing cycle turns; rural demand compresses due to weak monsoon or rural income stress. | A 5% revenue growth year (versus 10-15% target) would compress EBITDA to approximately Rs 350 crore on current cost structure. No existential risk but a material PAT impact. |
| International business losses | MEDIUM | AUD or EUR weakens sharply vs INR; European industrial downturn compresses Interplasp volumes; Australia faces macroeconomic headwinds. | Australia and Spain now both at 10% EBITDA margin. A reversal to 6% (FY25 levels) would add Rs 40-50 crore to consolidated losses. Spain debt of Rs 350 crore is self-liquidating but requires sustained profitability. |
| D2C and e-commerce competition | MEDIUM | Wakefit, Duroflex, or new well-funded players expand aggressively in tier-2 and tier-3 markets, precisely where Sheela's U2O channel operates. | No immediate financial impact. E-commerce value growth of 52% YoY in FY26 shows Sheela is currently winning this channel. Risk is erosion of pricing discipline over 2-3 years. |
| Depreciation policy change one-off | LOW | Sheela changed from written-down-value to straight-line depreciation in FY26. The change reduced FY26 depreciation meaningfully. Any further policy adjustment would affect reported PAT. | FY26 consolidated depreciation was Rs 179 crore, down 2% YoY despite higher asset base. Management guided Rs 140-145 crore for FY27E. This is a positive and non-recurrence risk rather than a downside. |
Valuation
Sheela Foam is a turnaround in the technical sense: reported earnings are recovering from a trough, ROCE is well below its historical peak, and the investment case rests on forward normalisation rather than historical performance. In this situation, trailing PE is misleading because the denominator is depressed. The appropriate primary methodology is forward EV/EBITDA, which is less distorted by the goodwill amortisation flowing through the depreciation line and allows comparison across different leverage scenarios.
The current enterprise value at Rs 743 per share, with market cap of Rs 8,110 crore, and net debt of approximately Rs 320 crore at FY26 year-end, computed as borrowings of Rs 908 crore minus investments of Rs 588 crore, gives an EV of approximately Rs 8,430 crore. Against FY26 reported EBITDA of Rs 395 crore on operating profit basis, this implies trailing EV/EBITDA of approximately 21.3x. The Rs 320 crore net figure is lower than the gross debt split discussed in the balance sheet section because it nets off the Rs 588 crore of investments the company holds against that borrowing.
Three forward scenarios are presented for FY27E. The bull case assumes RM prices stabilise at current levels and margins recover to 11%. The base case assumes RM prices remain elevated and margins hold at 10.5%. The bear case assumes sustained RM pressure and some loss of pricing power, compressing margins to 8.5%. Net debt assumptions for each scenario reflect the trajectory of operating cash generation versus debt repayment.
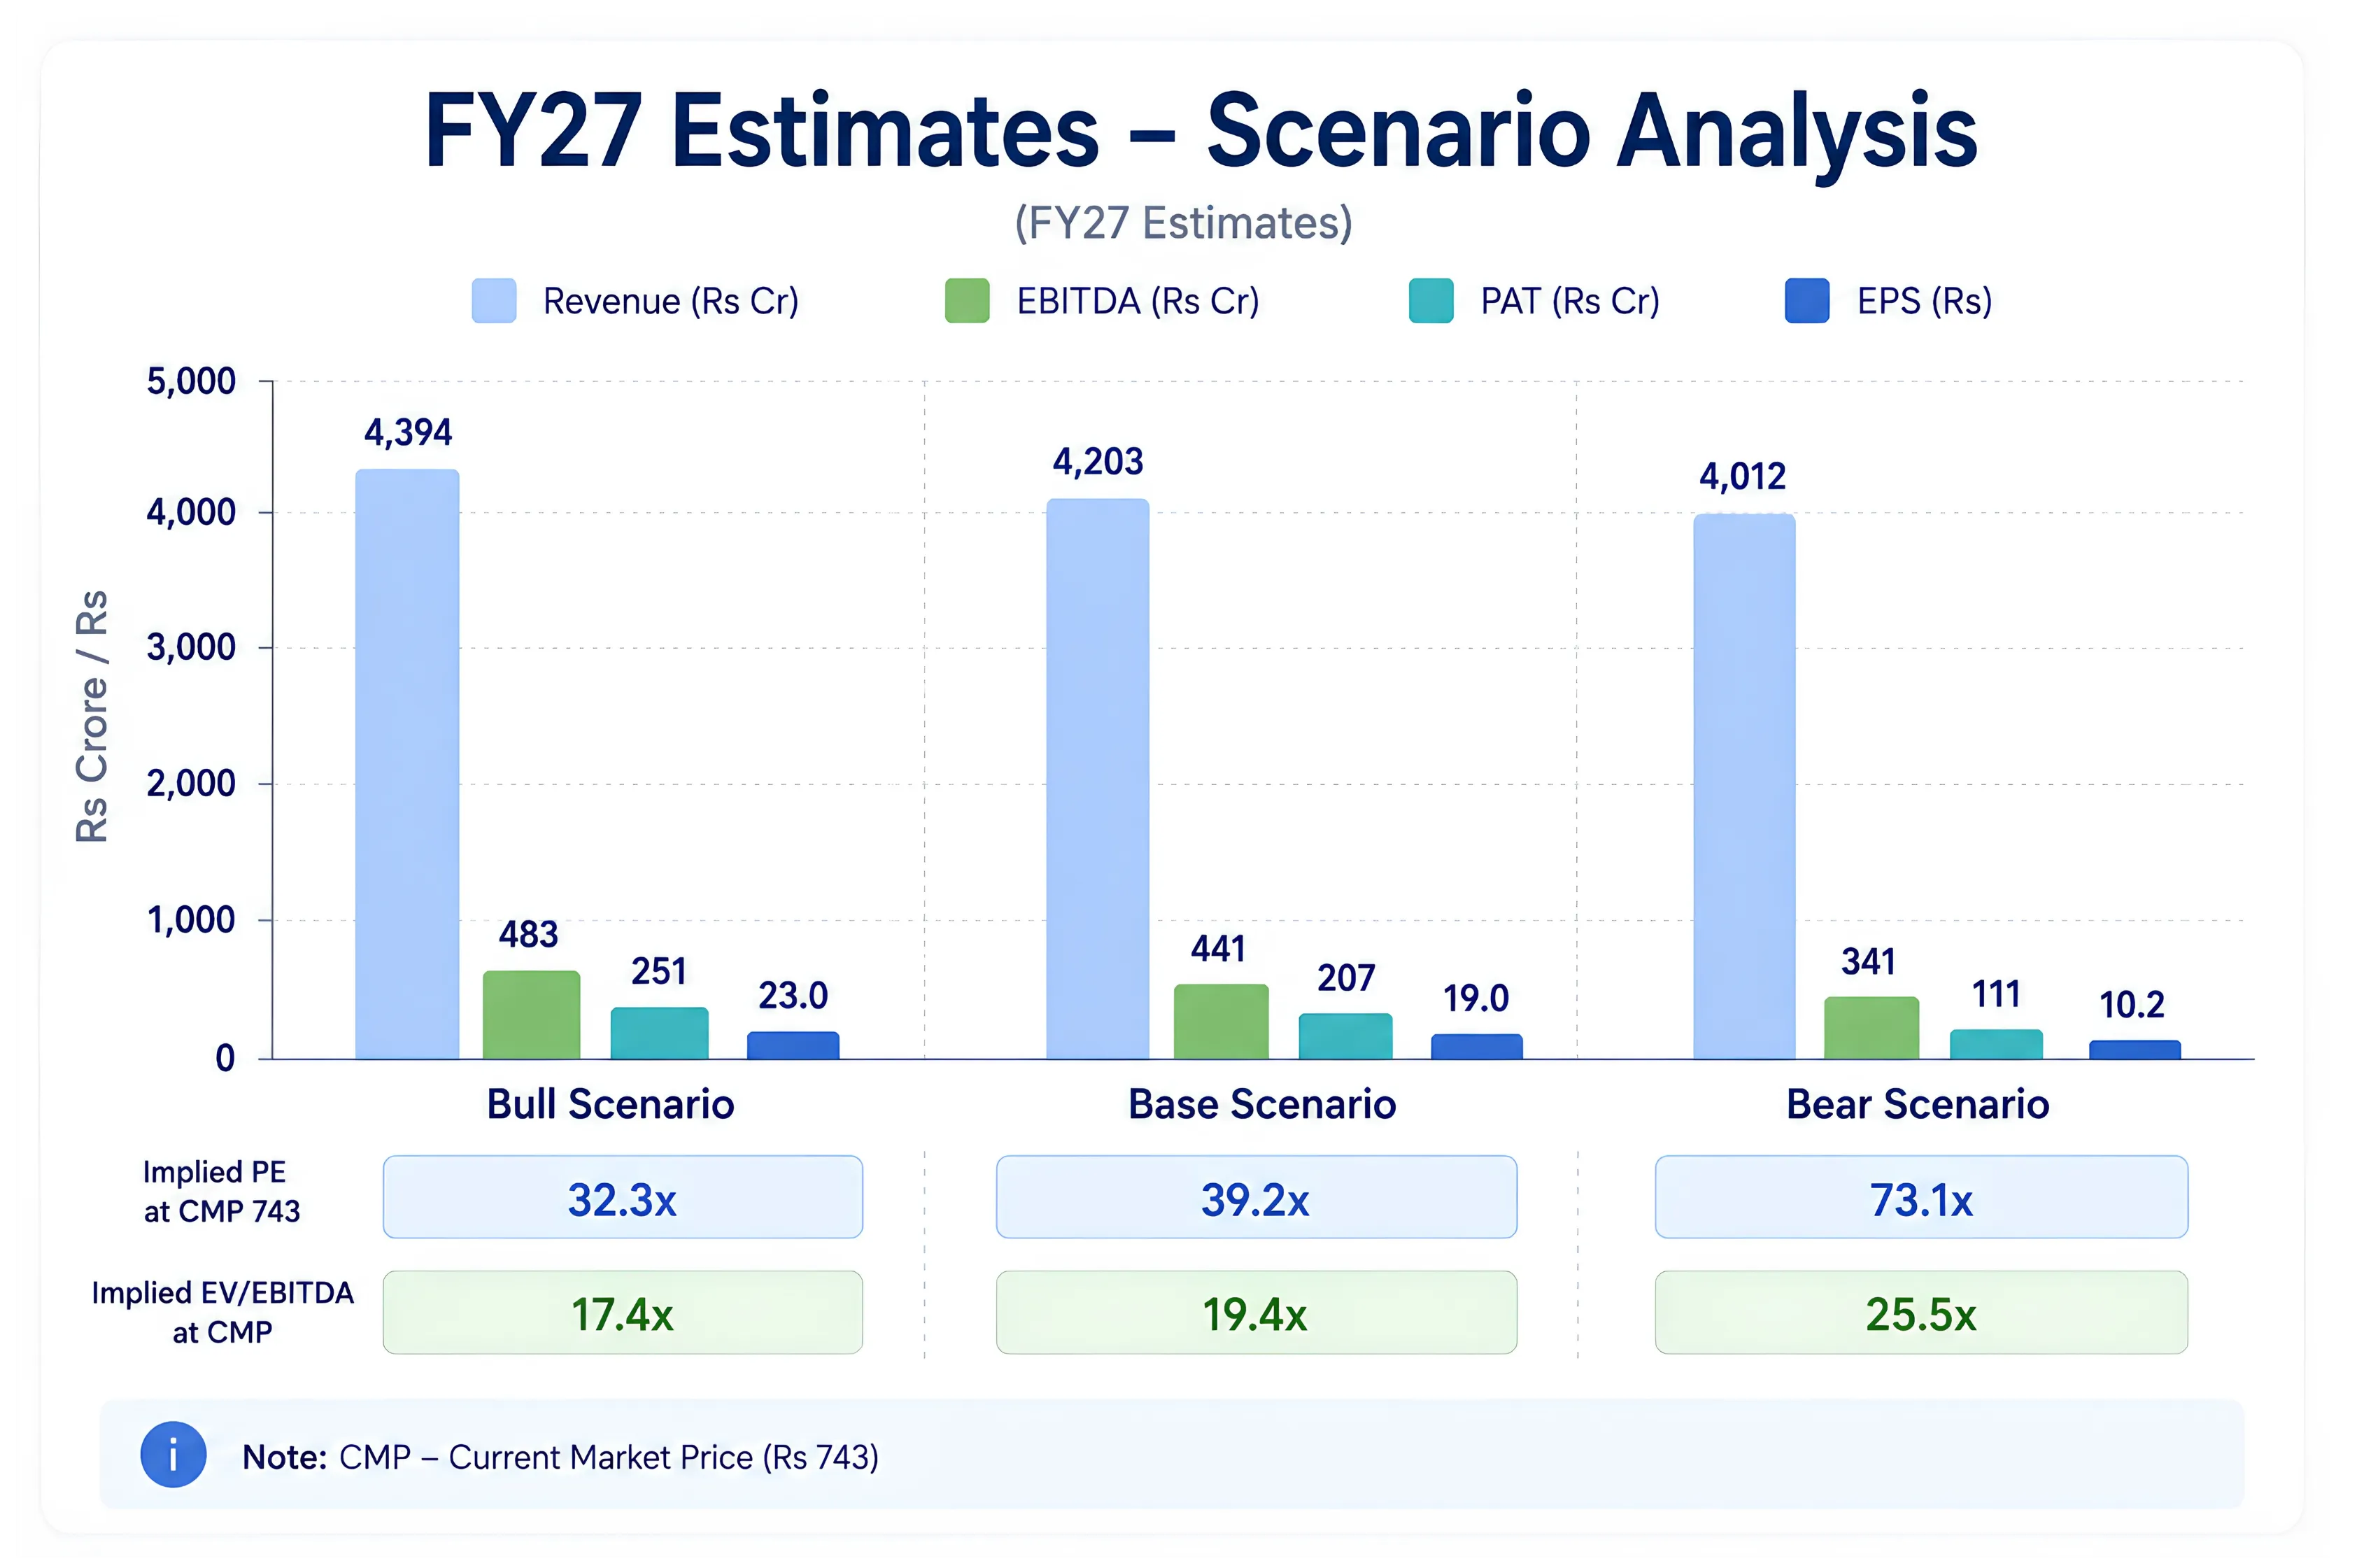
Current market price: Rs 743. Date: 29 June 2026. Shares outstanding: 10,91,98,924 (approximately 10.92 crore). Market Cap: Rs 8,110 crore. Net Debt assumptions: Bull Rs 300 crore, Base Rs 450 crore, Bear Rs 600 crore.
The scenario matrix shows that even in the bull case, the implied PE of approximately 32x and EV/EBITDA of approximately 17x do not suggest the stock is inexpensive relative to branded FMCG peers. In the base case, PE of approximately 39x and EV/EBITDA of approximately 19x price in a recovery that is already partially demonstrated. In the bear case, an implied PE above 70x would indicate the market is paying for a recovery that is not materialising. This asymmetry, modest multiple compression in the bull case against significant downside in the bear case, is the defining risk-reward characteristic of a recovery story where the market has already moved to price optimistic outcomes.
Stress Test
The stress scenario involves three adverse events simultaneously rather than the moderate bear case above. First, polyol and TDI prices spike back to their FY26 peak levels of Rs 220 and Rs 275 respectively and remain there, and Sheela is unable to pass through more than 40% of the increase. Second, Kurlon integration continues to drag, with Kurlon's standalone contribution margin remaining below the group average through FY27 due to continued channel conflict and elevated trade spending. Third, the international businesses see margin compression back to FY25 levels due to currency headwinds or demand softness, adding Rs 40-50 crore of consolidated EBITDA loss.
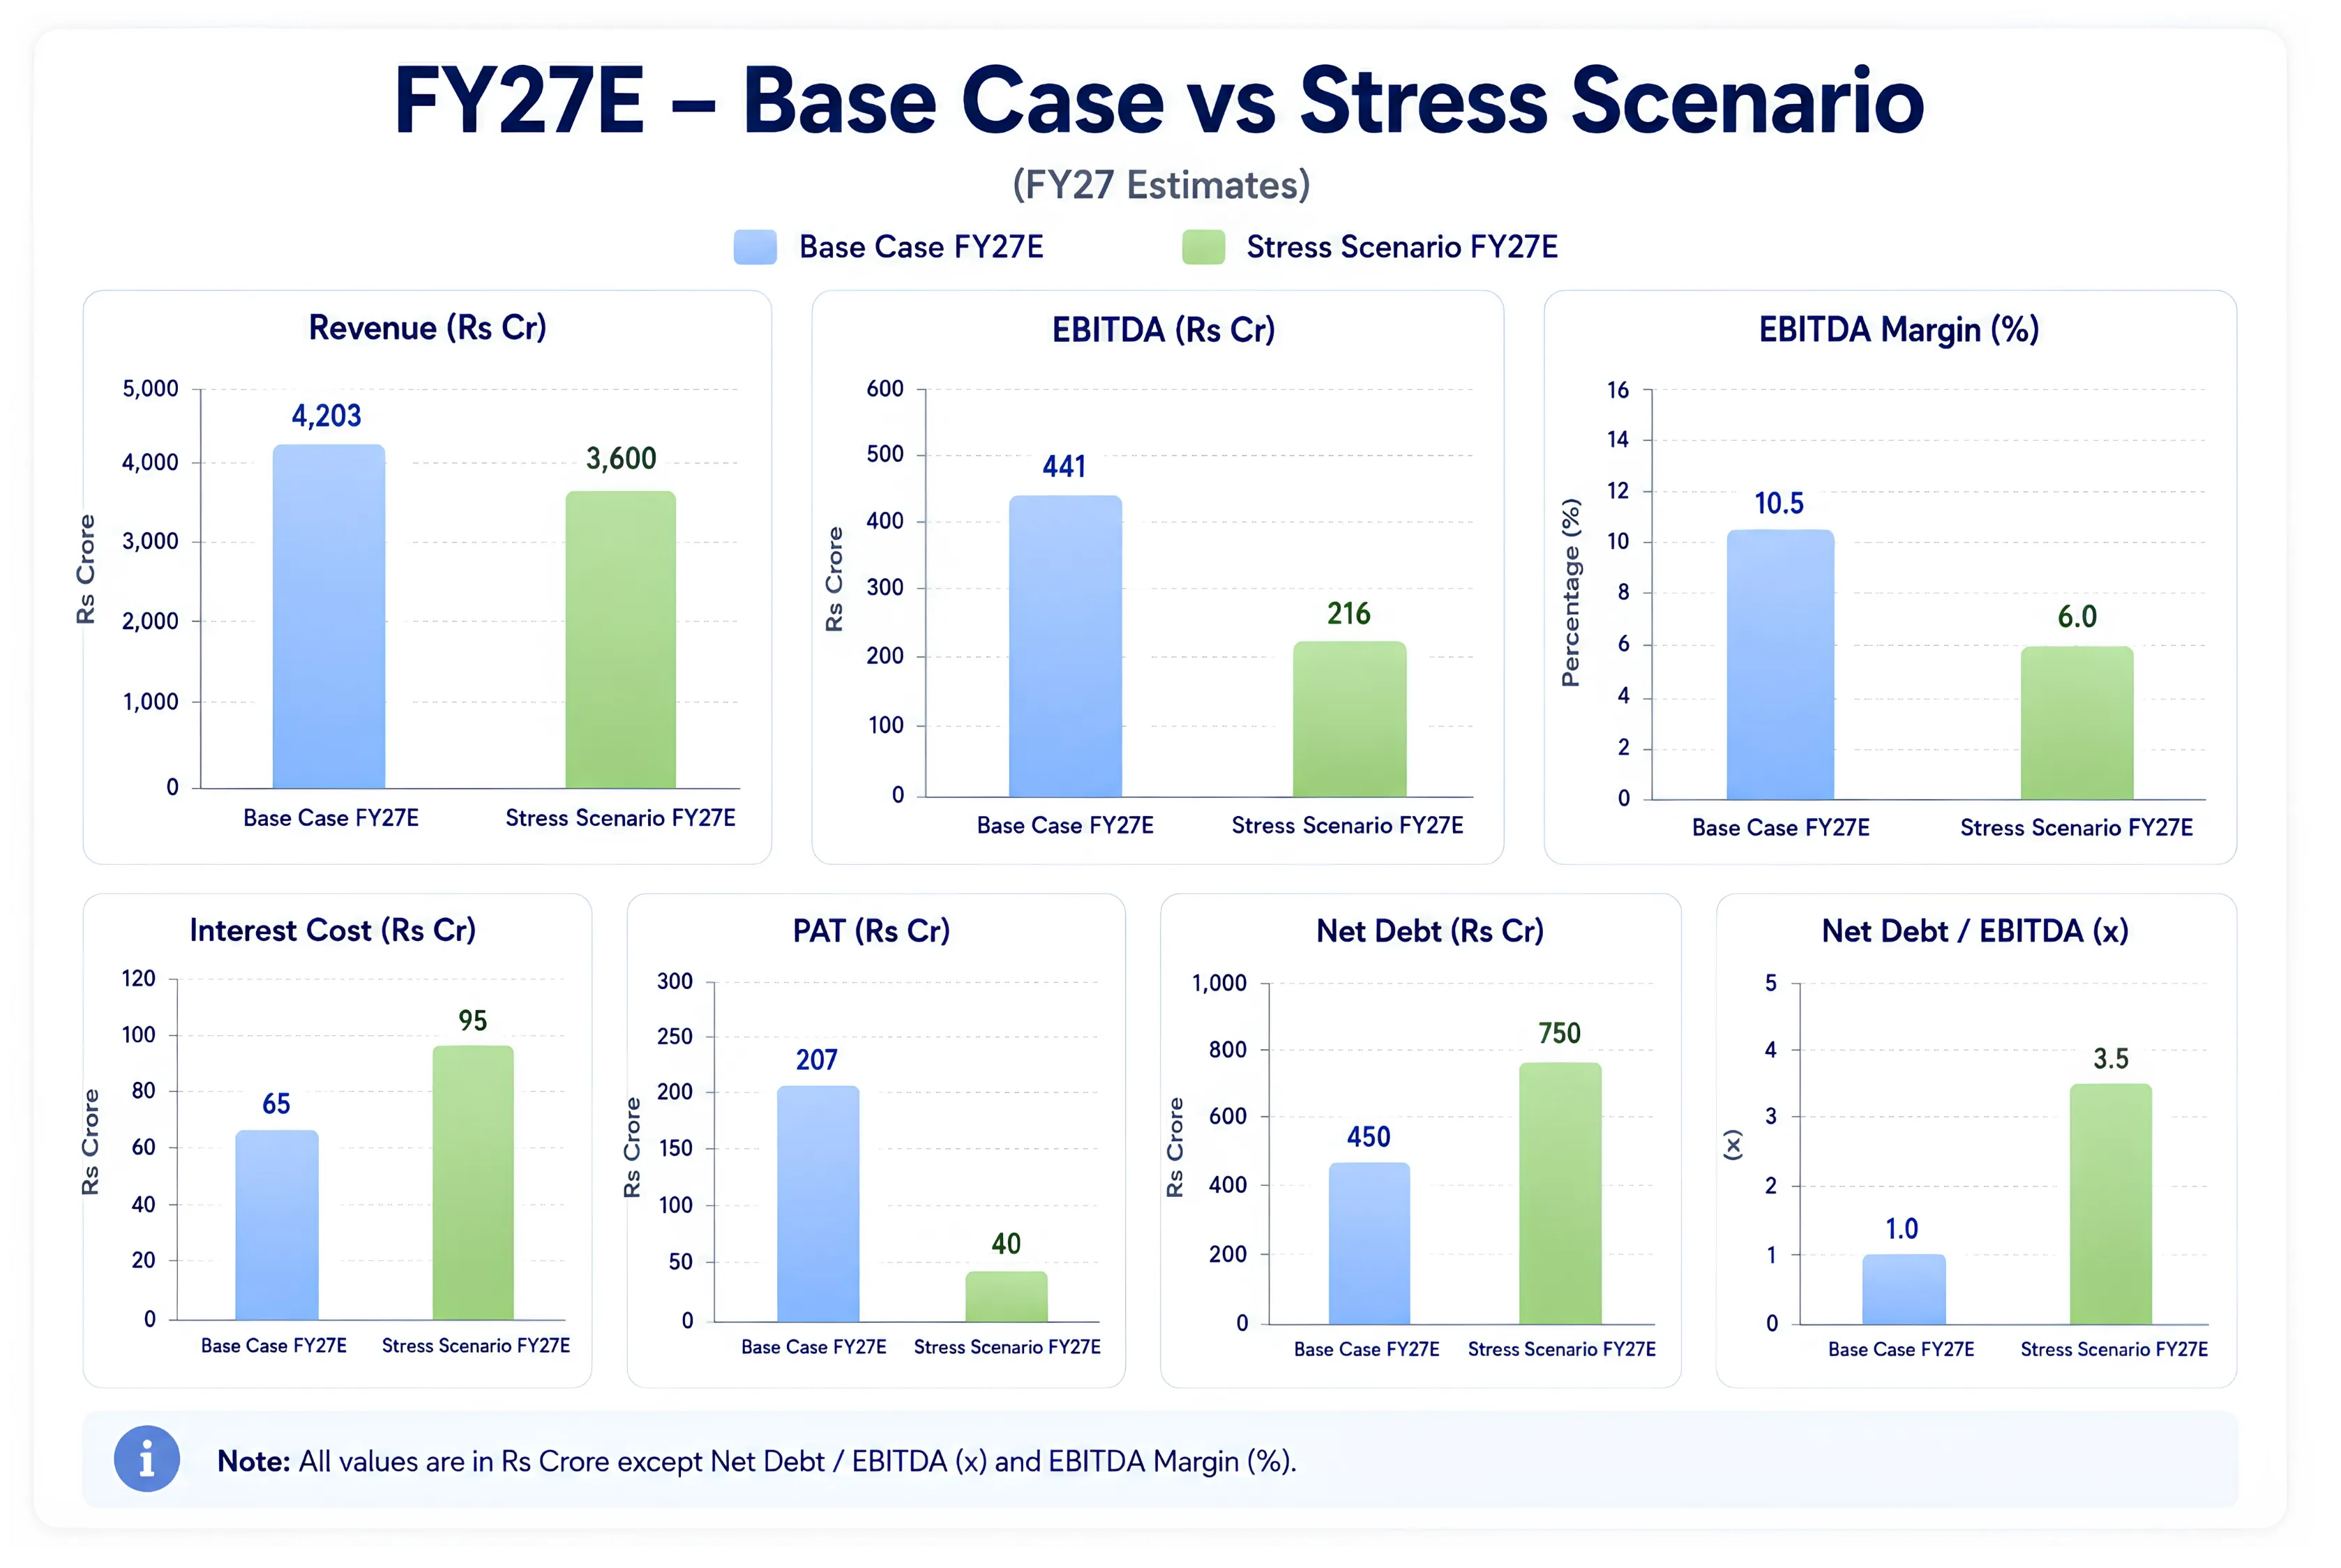
Stress scenario assumptions: RM spike to peak FY26 levels with 40% pass-through; Kurlon integration drag continues; international margins revert to FY25 levels. Base case uses FY27E estimates from the valuation section.
Under this combined stress scenario, consolidated EBITDA falls to approximately Rs 216 crore and PAT to approximately Rs 40 crore. Net debt, without the free cash flow available to de-lever, climbs back toward Rs 750 crore, pushing Net Debt to EBITDA to 3.5x, uncomfortable but not existential. The company would still generate positive EBITDA and positive, though thin, PAT. The balance sheet would not require emergency equity or refinancing at that leverage level given the operating cash generation capacity of the core India business. The threshold beyond which survival becomes genuinely uncertain would require a fourth adverse variable not present in this stress test, such as a simultaneous credit event in the international subsidiaries requiring substantial new capital from the Indian parent, or a collapse in retail mattress demand of a magnitude not seen in recent history. That combination is low-probability given current market conditions, but it is the correct framing for an investor who wants to understand the true floor.
Also Read: Laurus Labs FY26 in Review
Key Monitorables
| Metric | Why It Matters | Threshold |
|---|---|---|
| Core EBITDA Margin (consolidated) | The single number that tells you whether the Kurlon integration is working. Management has guided 11-12% as the new band. | Above 11% for two consecutive quarters: thesis intact. Below 9% for two quarters: reassess. |
| Net Debt trajectory | Management guided total debt to Rs 600-700 Cr. India debt of Rs 300 Cr should be repayable within 18 months from operating cash flows. | Declining each half-year. Any increase from FY26 levels without an acquisition rationale: flag for scrutiny. |
| Combined EBO count (Sleepwell + Kurlon) | The exclusive outlet network is Sheela's primary consumer touchpoint and distribution control mechanism. 600 net new showrooms were added in FY26. | Net new showroom additions of 600 or more per year, consistent with FY26 pace: thesis intact. A sharp slowdown in additions without explanation: flag for scrutiny. |
| Polyol and TDI price trajectory | Both raw materials moved 25-35% upward in FY26. TDI currently at Rs 275 per kg vs five-year average of Rs 240. Every sustained 10% RM rise compresses EBITDA margin ~100 bps. | Combined RM cost as % of revenue below 55%: margins safe. Above 60%: pricing stress is real. |
| Kurlon revenue growth | Kurlon volume grew 14% YoY in FY26 vs Sleepwell's 10%. Sustaining Kurlon's faster growth is central to the southern India penetration thesis. | Kurlon volume growth at or above 10% YoY and approaching Sleepwell margins by FY28: integration on track. |
Putting It Together
Sheela Foam spent two years absorbing a transformative acquisition, managing a volatile raw material environment, and rebuilding both its brand channel network and its operating efficiency. The result was a set of financials that look, on the surface, weaker than the underlying business warrants. ROCE at 6%, PE at 53x on trailing earnings, and PAT recovering from a Rs 90 crore trough invite no obvious enthusiasm on their own. But the trajectory beneath the surface tells a more considered story. FY26 delivered the highest-ever revenue, the highest-ever EBITDA, the highest-ever cash from operations, and the company's first-ever dividend. The EBITDA margin went from 7% to 10% in a single year, net debt fell by Rs 156 crore, and the international subsidiaries, which were losing money, are now contributing at 10% EBITDA margin each.
What remains to be proven is whether the 11-12% EBITDA margin management has guided is durable rather than cyclical. FY26's improvement was aided by a period of partial RM stabilisation and a depreciation policy change. If both polyol and TDI remain at their elevated current levels for the full year FY27, margin sustainability will be tested without the tailwinds that helped FY26. The Kurlon integration also needs to be demonstrated across four to six more quarters before it can be called complete, specifically whether Kurlon's brand equity in southern India is being strengthened by Sheela's distribution investment or eroded by channel overlap.
Investors tracking this company should watch the core EBITDA margin print each quarter, the net debt trajectory, and the Kurlon volume growth number as the three most direct indicators of whether the thesis is executing or stalling.
Disclaimer: The information provided in our blogs is for informational purposes only and should not be construed as financial, investment, or trading advice. Trading and investing in the securities market carries risk. Always conduct your own research and consult with a qualified financial advisor before making any investment decisions. Past performance is not indicative of future results. Copyrighted and original content for your trading and investing needs.
© 2026 — Tradejini. All Rights Reserved.