


The Indian cement sector, the second largest in the world, is undergoing a transformative phase characterized by robust infrastructure spending, aggressive capacity expansions, and unprecedented consolidation. As a reliable proxy for national economic health, the India cement industry reflects both the urgency of the country's development agenda and the scale of private capital being deployed to meet it. While the first half of the previous financial year witnessed muted demand due to general elections and extreme weather events, the second half saw a sharp recovery. The industry is poised for a multi-year growth cycle supported by structural tailwinds, government capital expenditure, and a shift towards sustainable manufacturing practices.
This report presents a cement industry fundamental analysis to help investors and industry observers understand the sector's structural dynamics and medium-term cement industry outlook.
India Cement Market Size: Cement Demand and Capacity Growth
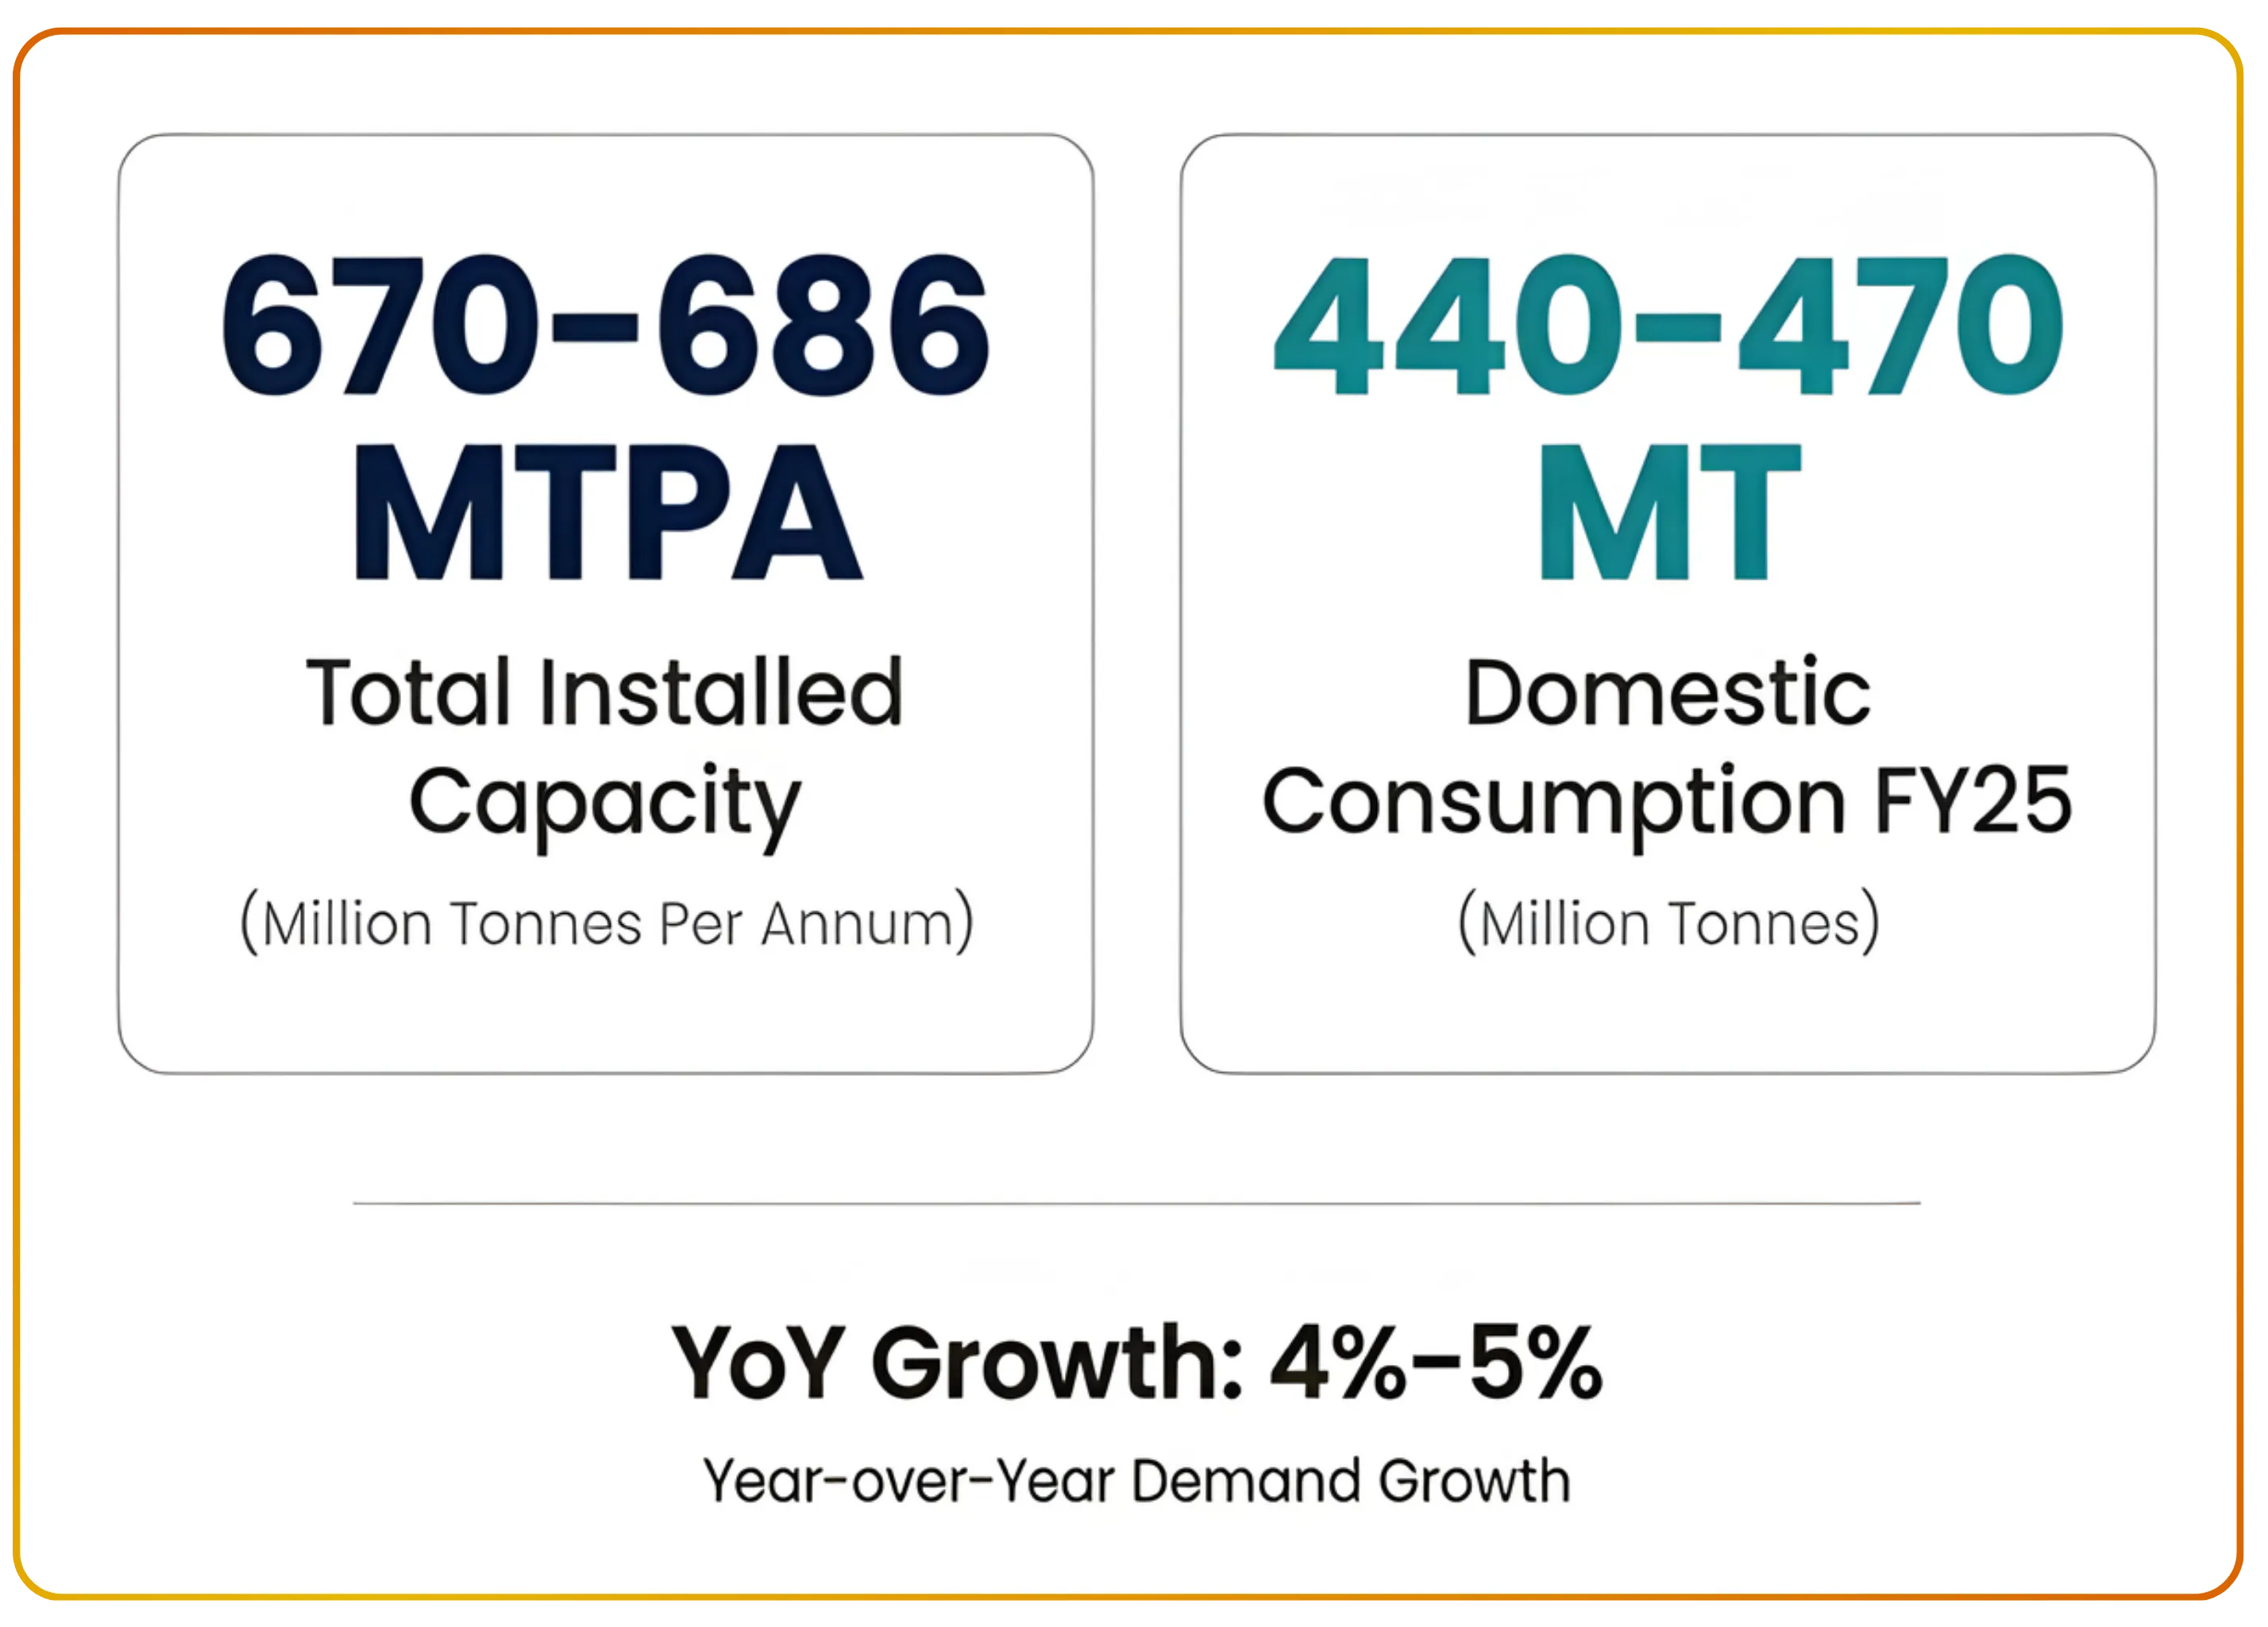
As of FY 2025, the India cement market size stood at an installed capacity of approximately 670 to 686 million tonnes per annum. Cement demand in India stood between 440 and 470 million tonnes, registering an estimated year-over-year growth of 4% to 5%.
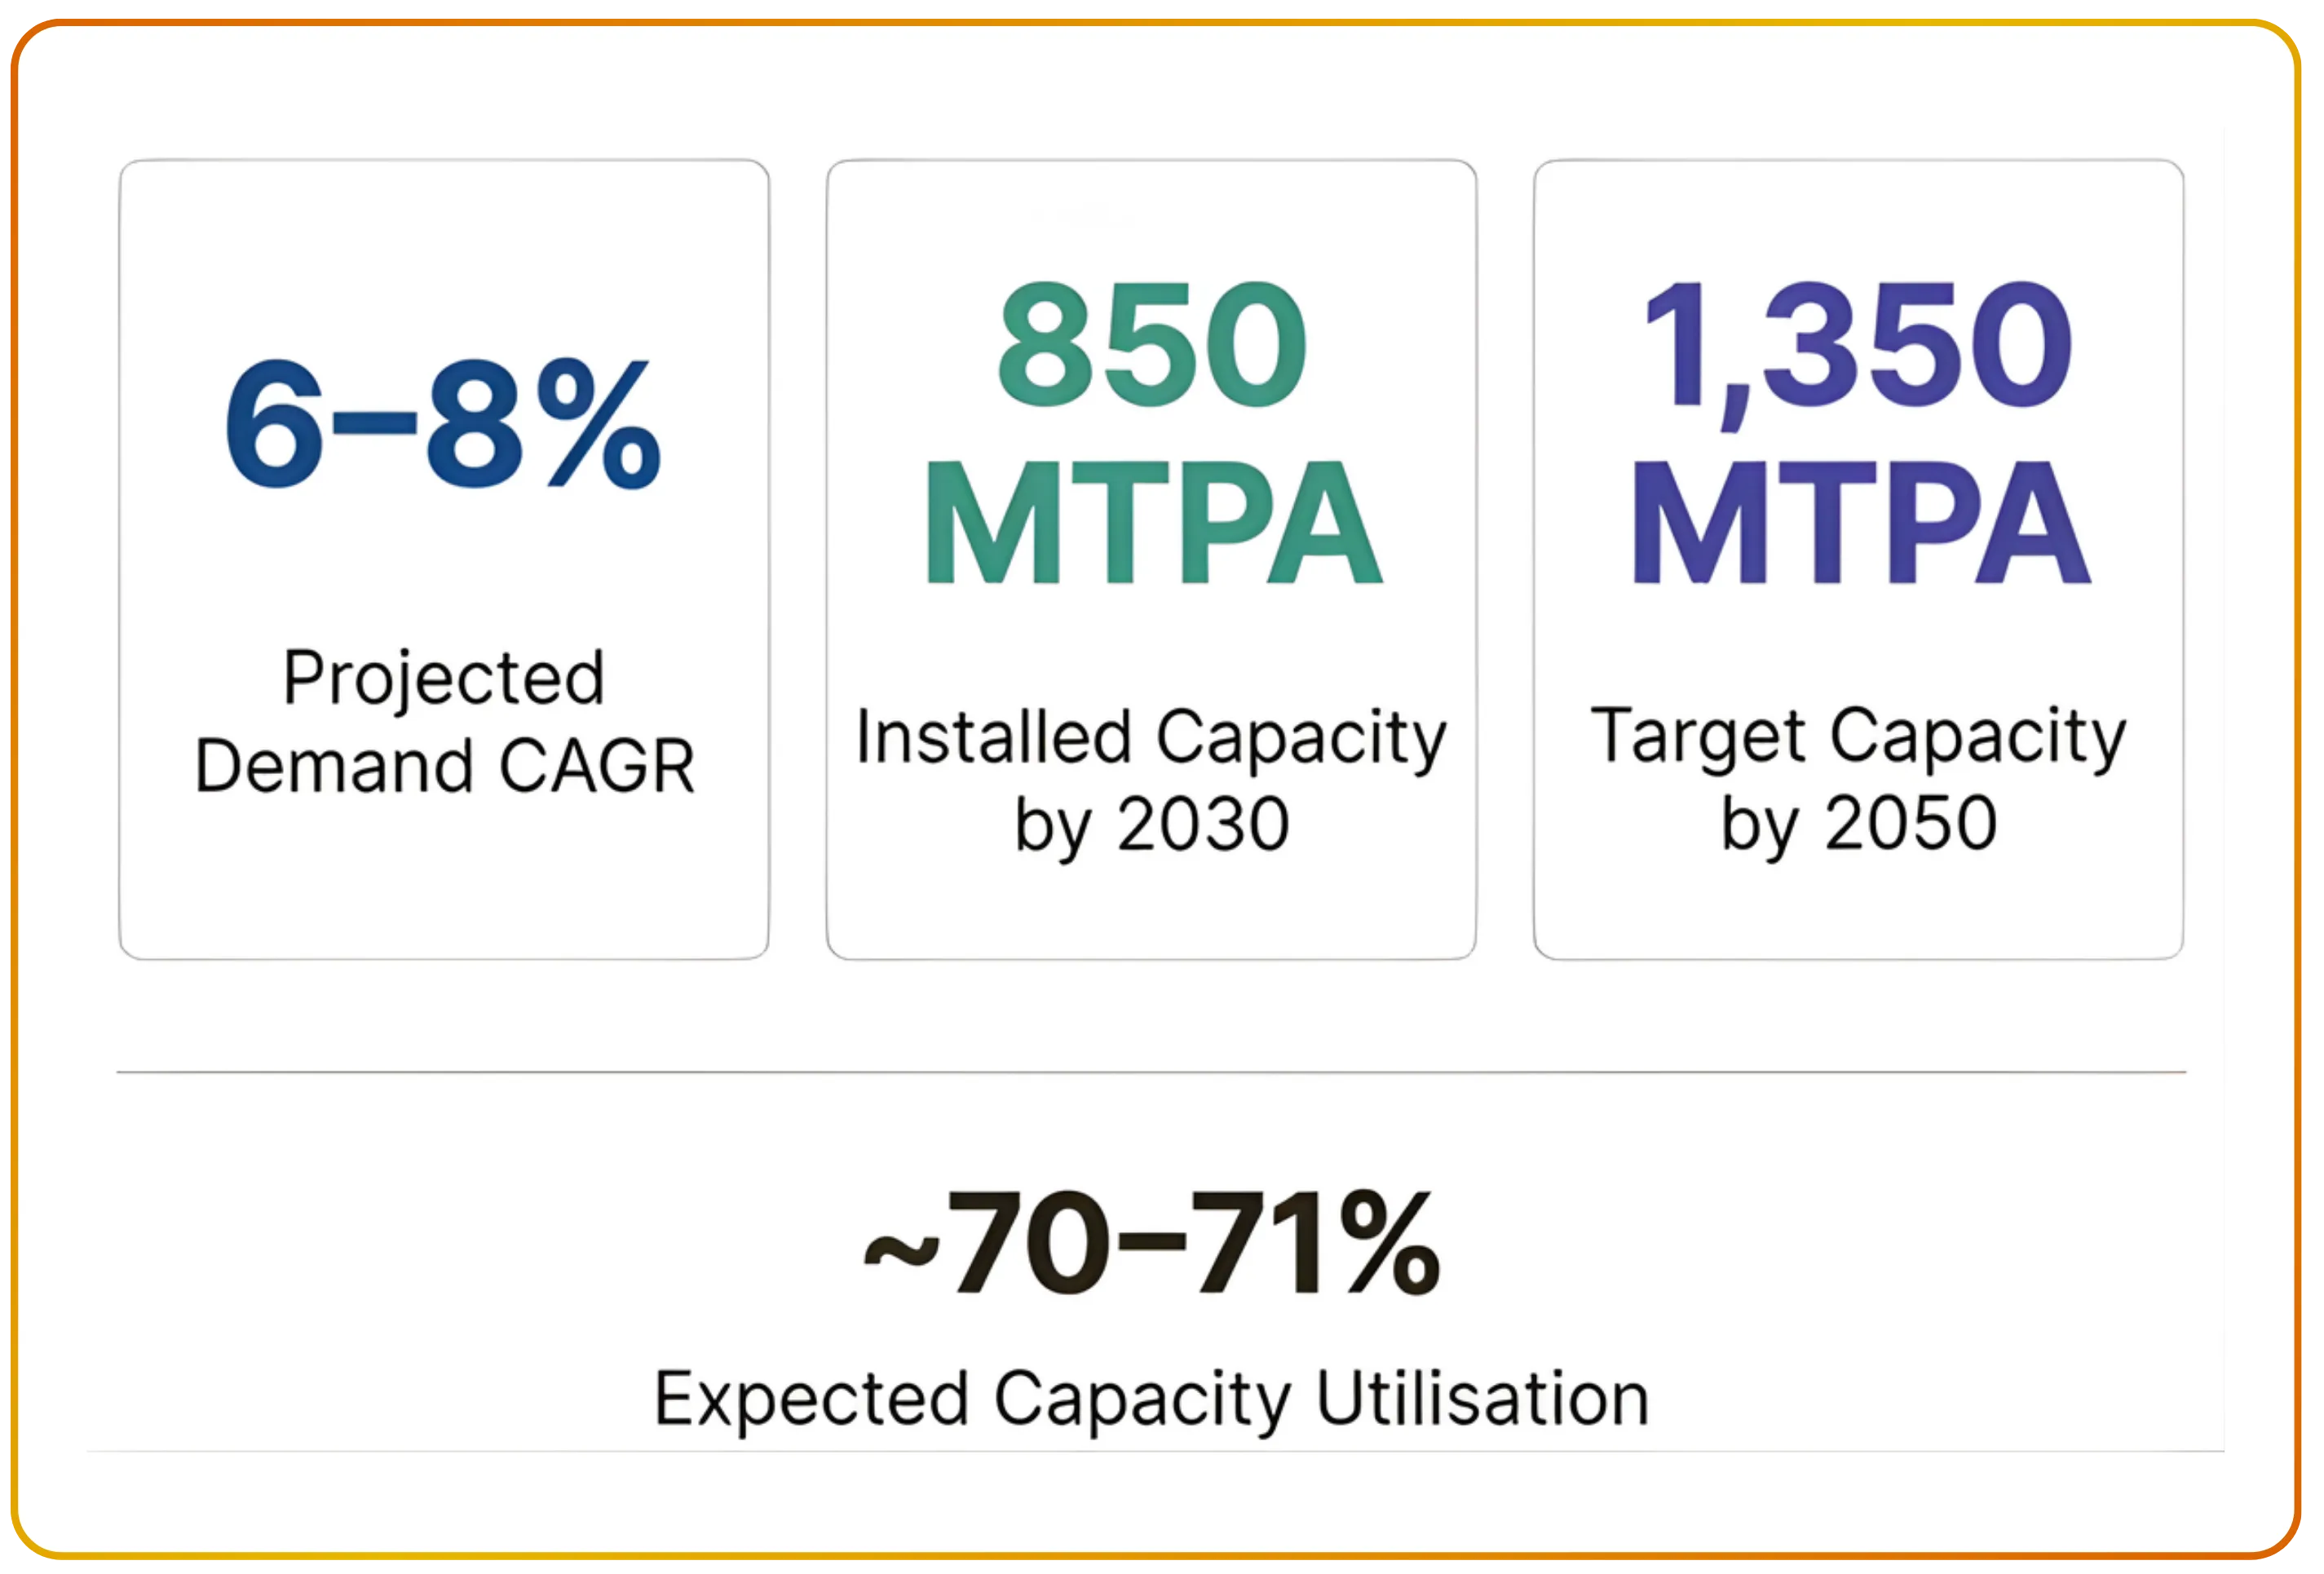
Looking ahead, the demand outlook remains highly optimistic. The industry is projected to grow at a Compound Annual Growth Rate (CAGR) of 6% to 8% over the next few years. To meet escalating demand, cement capacity in India is projected to reach 850 million tonnes per annum by 2030 and an ambitious 1,350 million tonnes by 2050. "Despite aggressive expansions, cement capacity utilization rates are expected to stabilize near 70% to 71%, reflecting a manageable supply-demand balance. This trajectory positions cement sector growth in India as one of the most compelling long-duration investment themes in the materials space.
Cement Demand in India: Housing, Infrastructure, and Commercial Tailwinds
The demand for cement in India is broadly categorized into three main segments:
| Segment | Share of Demand | Key Drivers |
|---|---|---|
| Housing | 60% – 65% | Cement housing demand in India constitutes the largest segment at 60% to 65% of total consumption, driven by urbanization and rising incomes. |
| Infrastructure | 24% – 25% | Cement infrastructure demand in India is the fastest-growing segment, contributing 24% to 25% of total volumes and supported by record government capital expenditure. Accelerating cement urbanization in India (with millions migrating to cities each decade) continues to structurally underpin long-term housing and commercial demand. |
| Commercial & Industrial | 10% – 14% | Surging India infrastructure spending, including highways, railways, and ports, is directly translating into incremental cement volumes across the country. |
Government Policy Impact
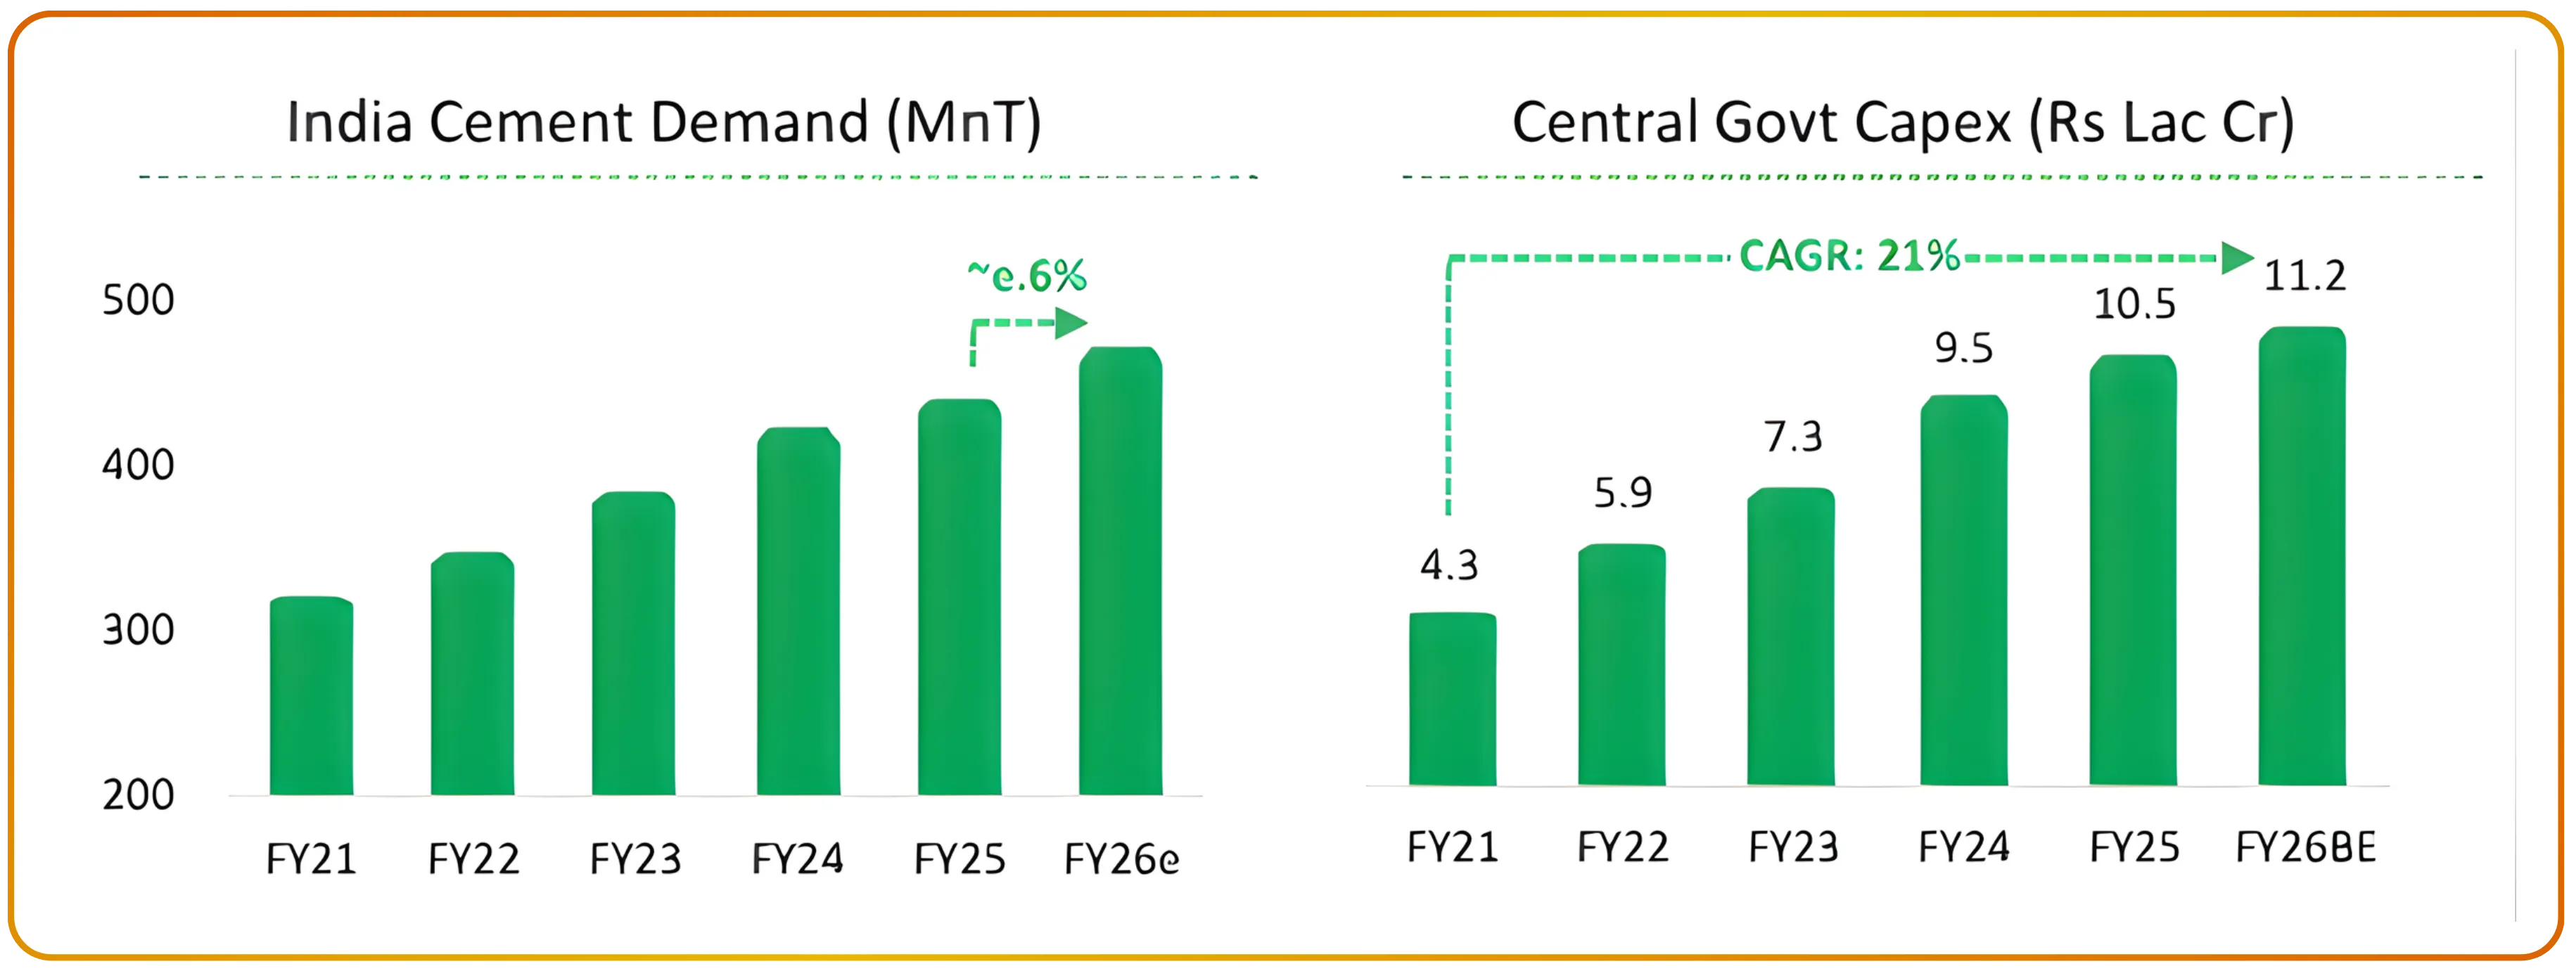
Cement government spending in India continues to act as the primary demand catalyst, with the Union Budget allocating a record INR 11.21 lakh crore (approximately USD 129.5 billion) towards capital expenditure (equivalent to 3.4% of GDP).
PMAY cement demand is a critical driver, as millions of affordable urban and rural homes are slated for construction under the Pradhan Mantri Awas Yojana scheme.
Infrastructure Upgrades: Massive investments in national highway networks, the Amrit Bharat Station Scheme for modernizing railways, and the Maritime Amrit Kaal Vision for port expansion.
Urban Development: The creation of a INR 1 trillion Urban Challenge Fund to support modern city infrastructure.
Beyond housing, cement capex in India is being directed towards highways, modernized railway stations under the Amrit Bharat Scheme, and port expansion under the Maritime Amrit Kaal Vision.
Cement Energy Costs in India: Coal, Petcoke, and the Shift to Renewables
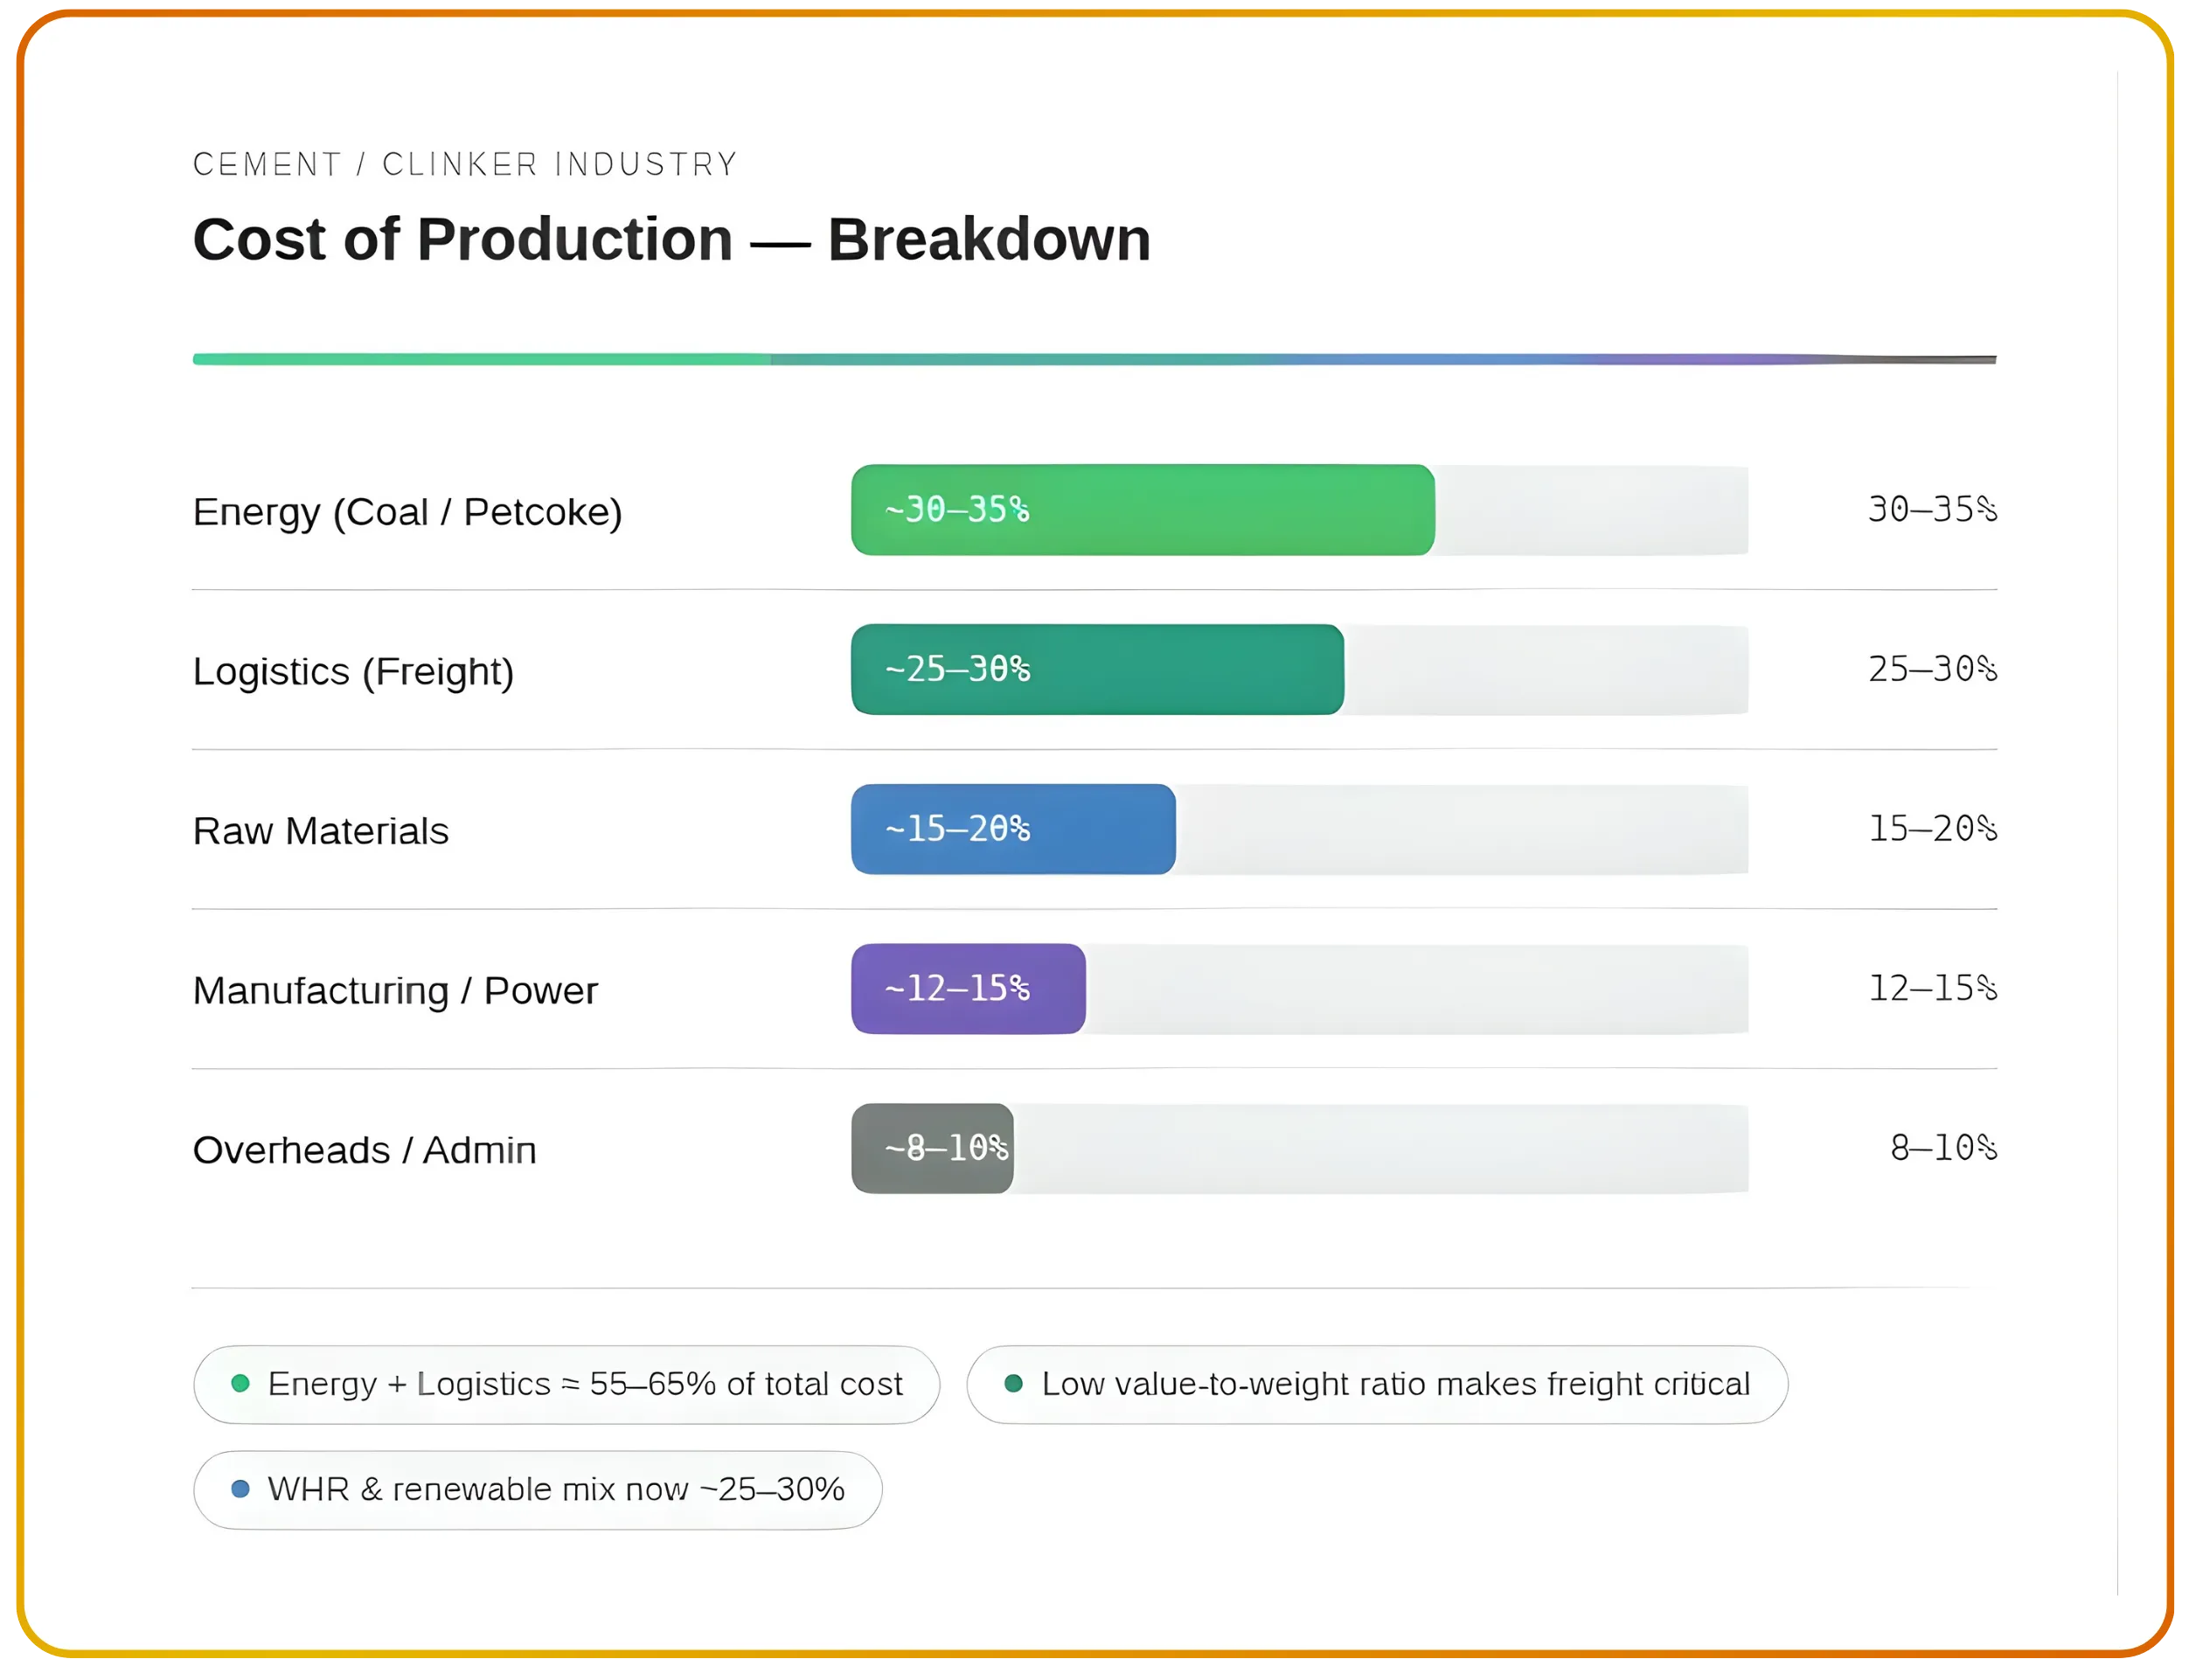
Cement energy costs in India are the single largest component of the cost base, driven primarily by coal and petroleum coke consumption. Profitability remains highly sensitive to fluctuations in cement petcoke prices, as petroleum coke is a primary kiln fuel for most manufacturers.Recent moderation in cement coal prices in India and globally has expanded operating margins across the board, providing temporary relief to producers. The cost of production in the cement industry is heavily skewed towards energy and cement logistics, which together account for more than half of the total cost base. To structurally reduce fuel dependency, leading players are aggressively investing in waste heat recovery systems for cement manufacturing, which converts kiln exhaust into usable electricity. Freight costs are also significant due to the low value to weight nature of cement, which makes transportation a critical factor in overall cost efficiency. Raw materials and manufacturing expenses contribute a moderate share, while overheads remain relatively controlled. Although the adoption of waste heat recovery systems and renewable energy is gradually improving cost efficiency, the sector continues to rely substantially on conventional energy sources, reinforcing its exposure to input cost volatility. Cement renewable energy in India is gaining rapid traction, with the industry average for solar and wind usage approaching 25% to 30% of total power consumption
Cyclicality and Commodity Dependence
The cyclical nature of the cement industry means that demand is strongly correlated with macroeconomic cycles, agricultural output, and monsoon patterns — factors that introduce meaningful quarterly volatility. Construction activity typically slows down during the heavy monsoon quarters and accelerates during the dry seasons.
Furthermore, the industry is highly capital and energy intensive. Logistics and energy form the largest components of operational expenditure.
Input Materials: Profitability is sensitive to fluctuations in global prices of coal and petroleum coke (petcoke). Recent moderations in international energy prices have expanded operating margins across the board.
Cost Optimization: To mitigate commodity risks, cement manufacturers are aggressively restructuring their energy mix. Companies are heavily investing in Waste Heat Recovery Systems (WHRS), solar, and wind energy. The industry average for renewable energy usage is rapidly approaching 25% to 30%, which not only insulates companies from global energy shocks but also addresses stringent emission norms. Logistics costs are being optimized through higher rail penetration, digitizing transport routes, and utilizing alternative fuels for transport.
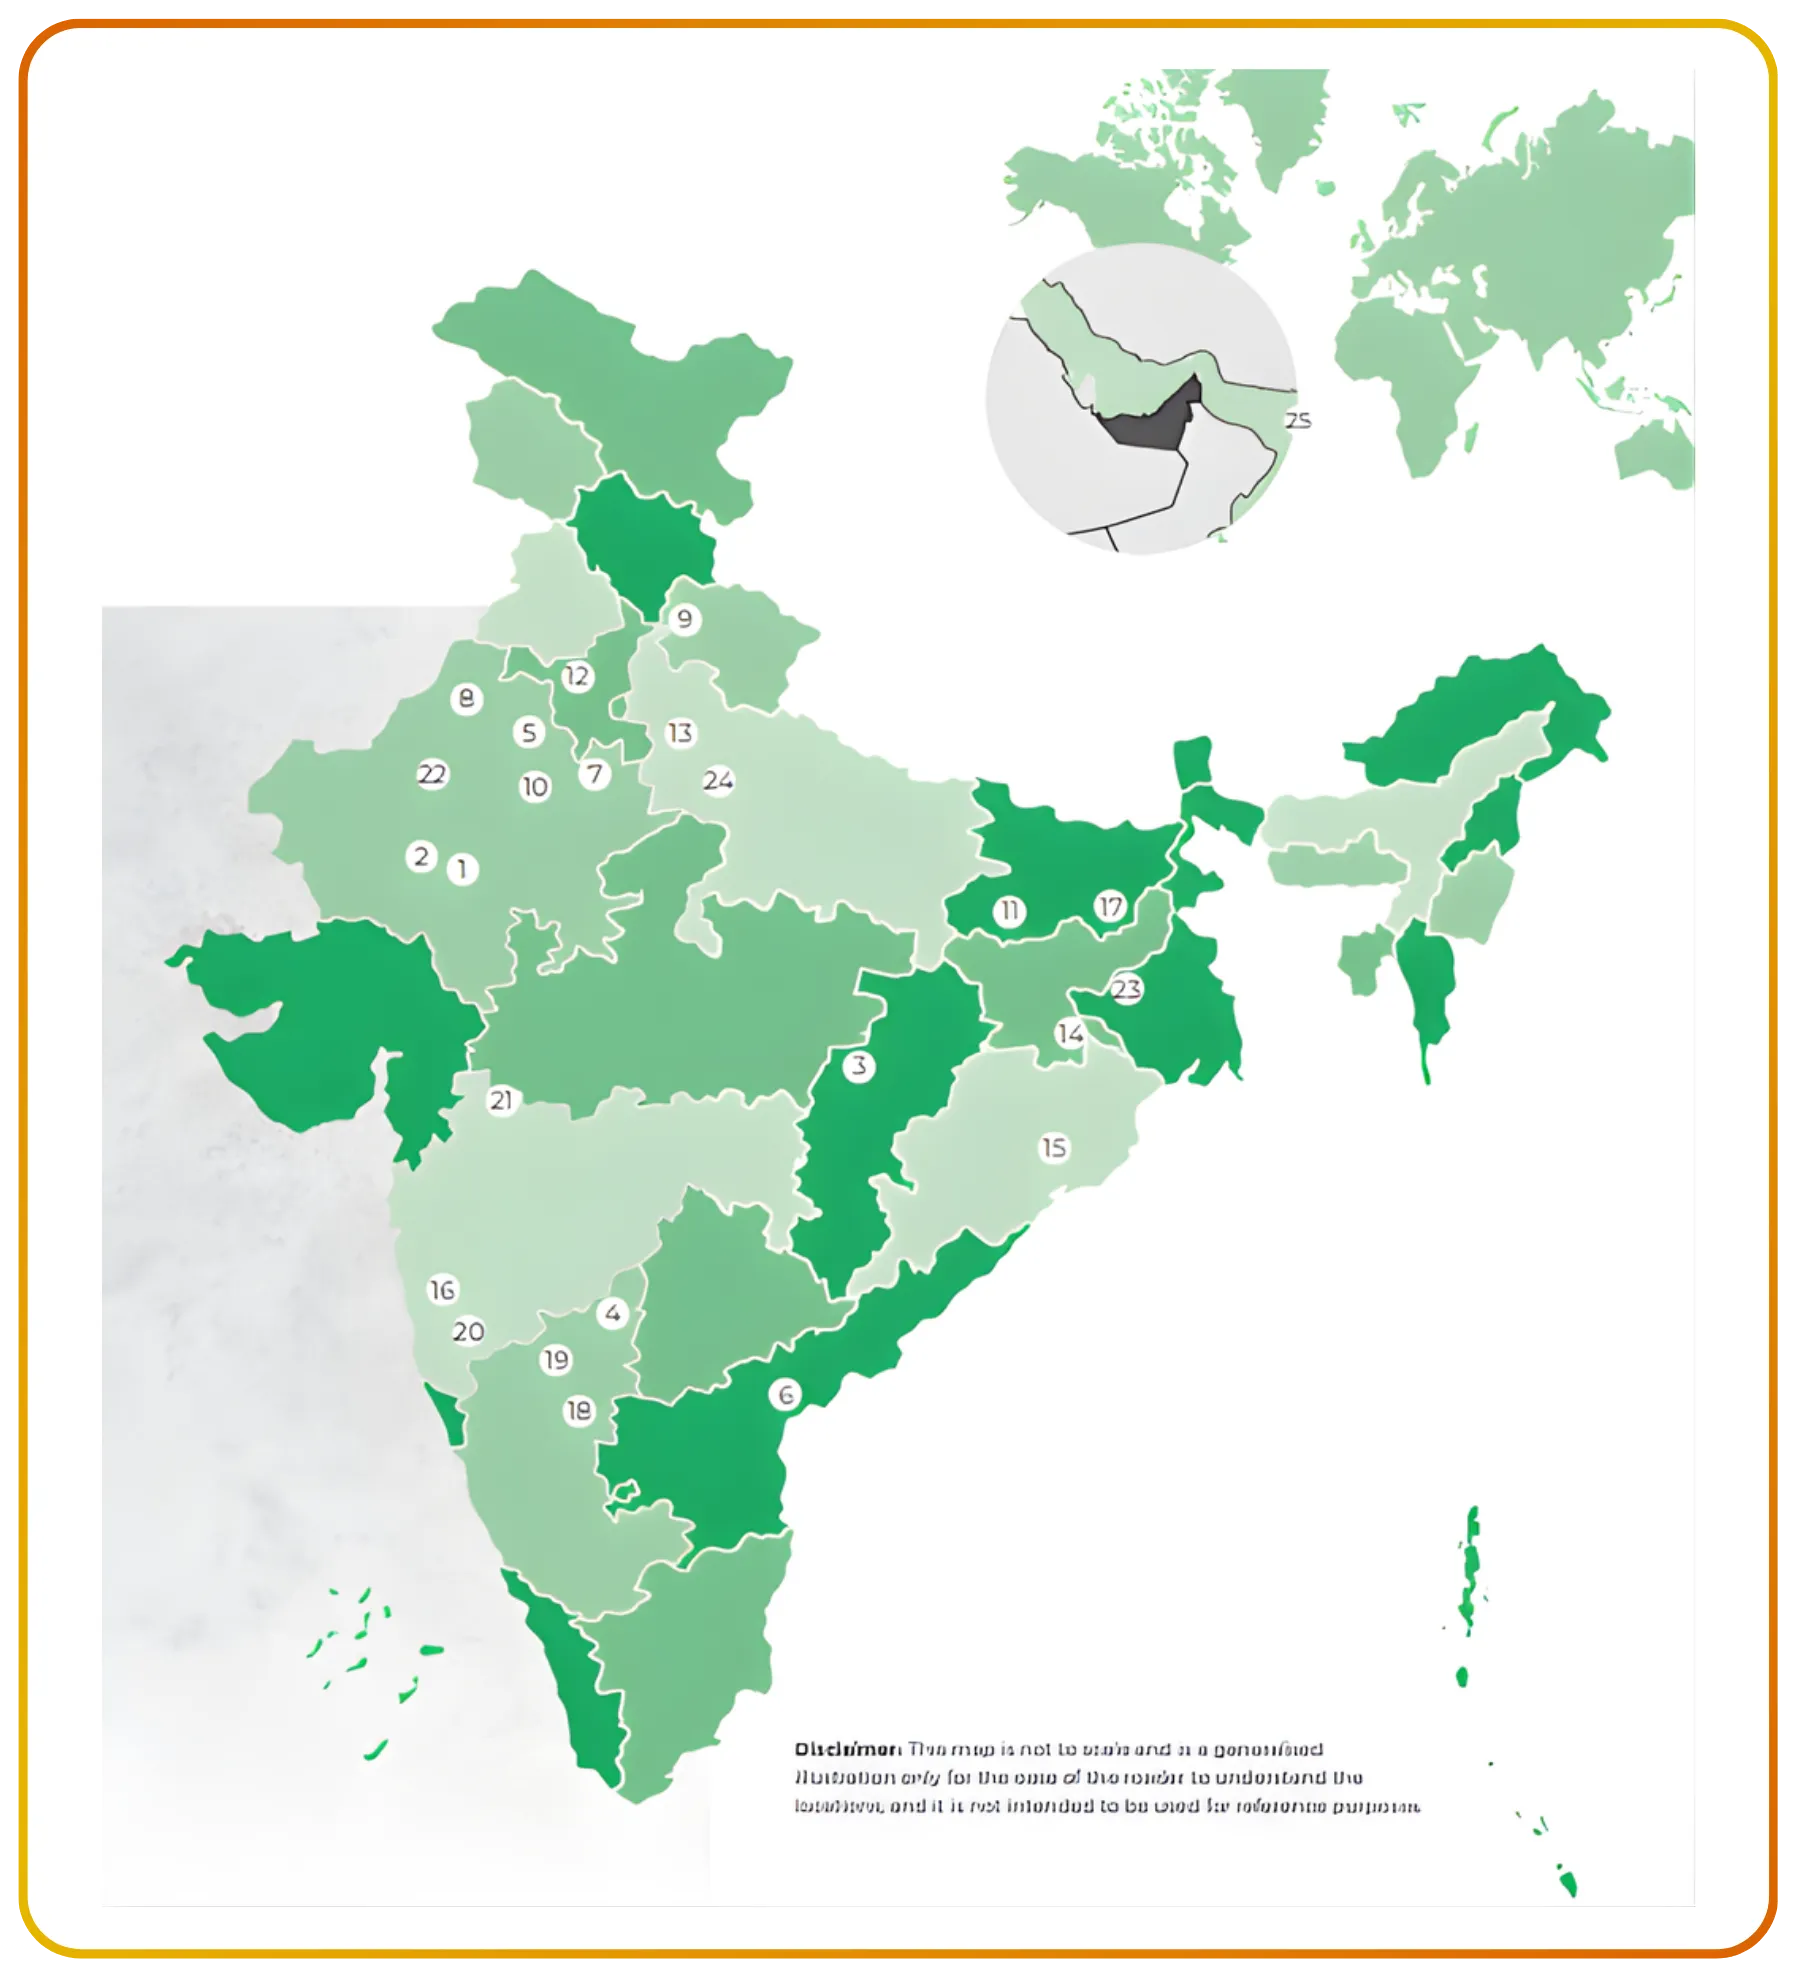
Cement Regional Markets in India: North, South, East, and Growth Corridors
Because cement is a low value-to-weight commodity, the industry functions through distinct cement regional markets in India (North, South, East, West, and Central) each with its own supply-demand dynamics.
Among these, cement in North and South India presents a study in contrasts: the North benefits from tighter supply and stronger pricing power, while the South remains burdened by fragmented competition and excess capacity. Cement demand growth in East India is expected to be the fastest in the country, with the Eastern and Central regions together accounting for over 50% of all new capacity additions over the next two years.
Cement Industry Consolidation in India: Competitive Landscape and Market Share Shifts
Cement industry consolidation in India is advancing at its fastest pace since 2014, with the top four manufacturers now controlling approximately 58% of total supply.This consolidation is driven by larger balance sheets acquiring smaller, regional players to quickly gain market share and enter new geographies.
India's infrastructure boom extends well beyond cement — for a closer look at another key beneficiary of this capex cycle, check out A Sectoral Breakdown of India's Cables and Wires Industry.
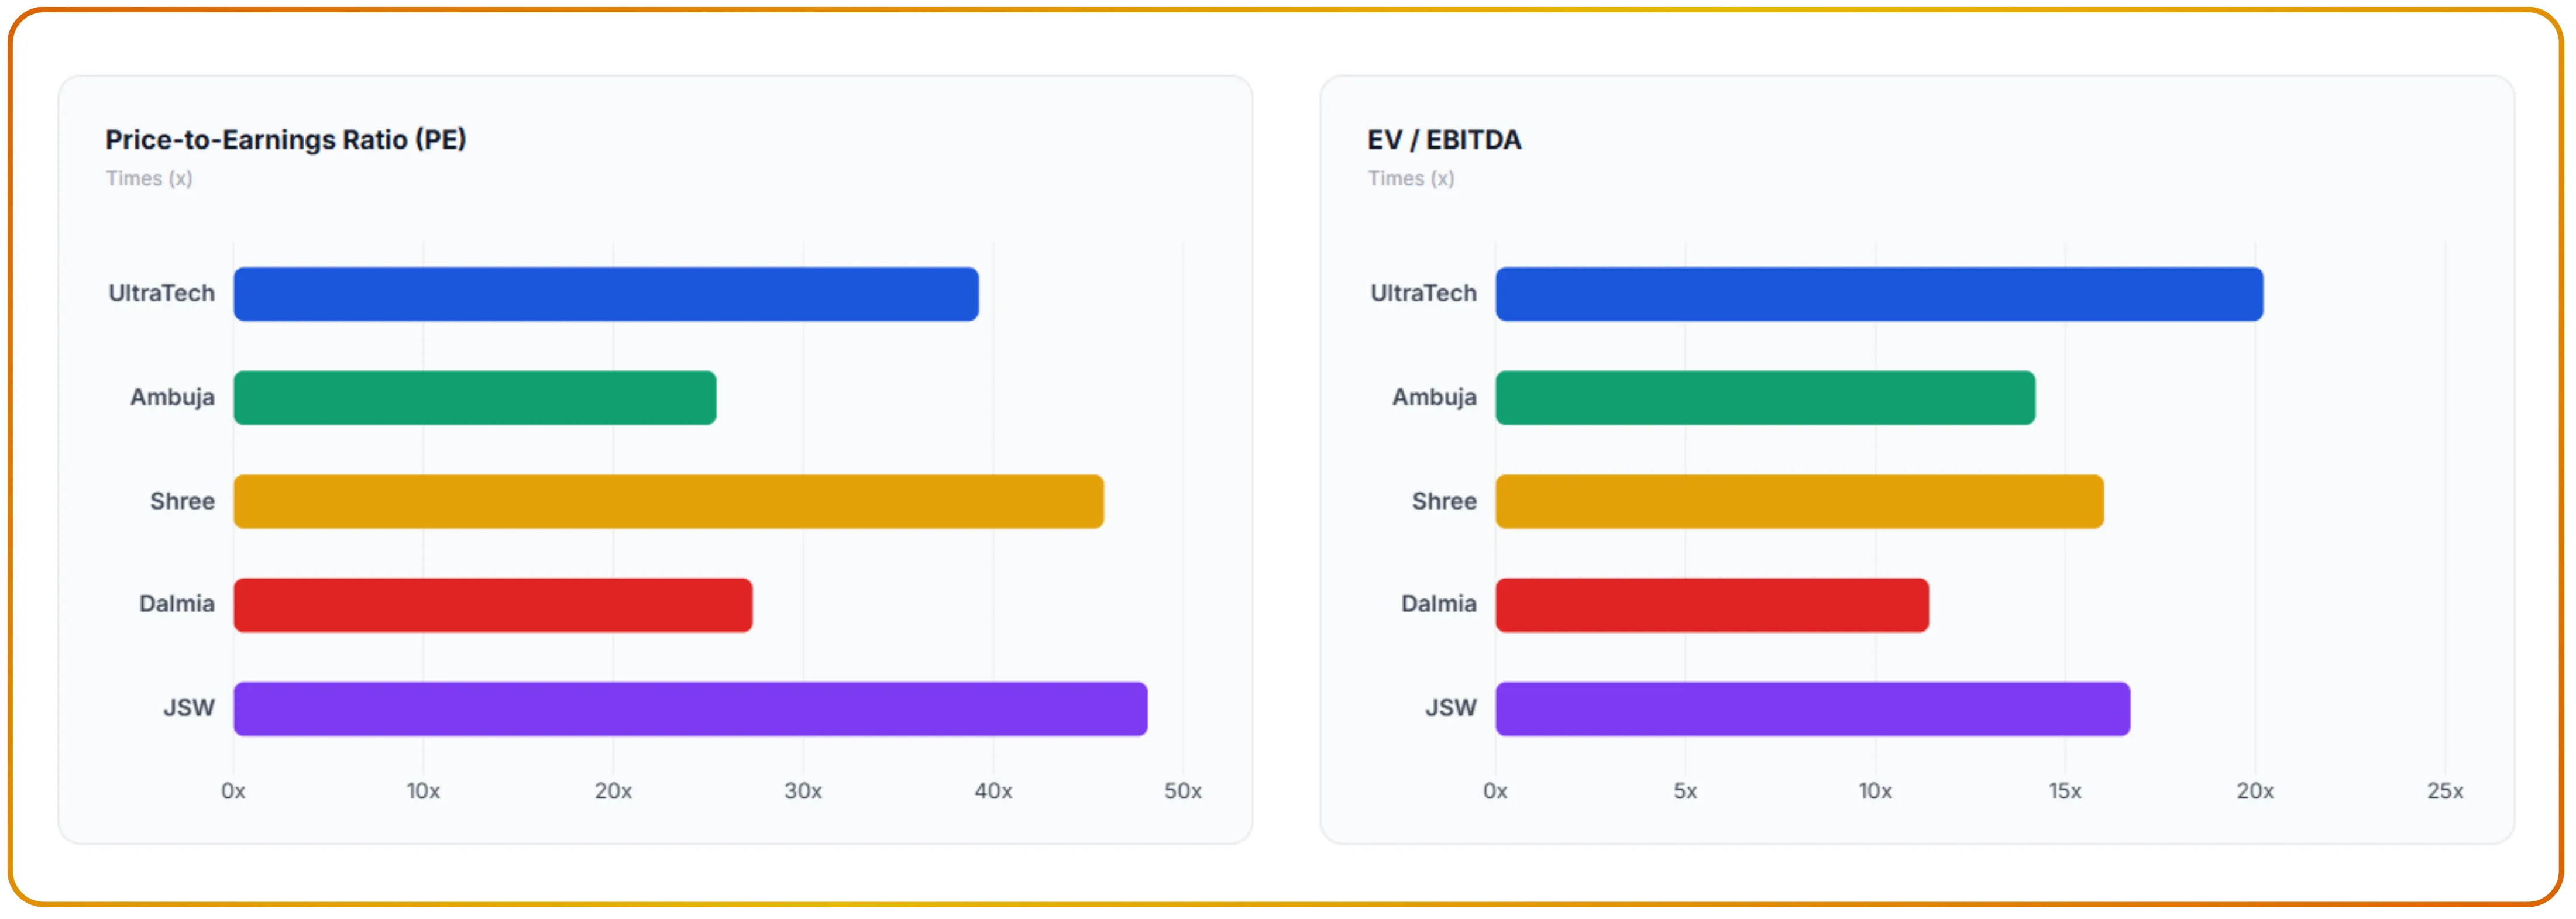
Peer Comparison (TTM upto Q3FY26, Consolidated) in ₹ Cr
The table below presents a cement sector valuation snapshot for the top five listed players, including metrics such as cement OPM, cement PE ratio, and cement EV/EBITDA to aid in comparative analysis.
| Company | Mkt Cap | Sales TTM | OPM (%) | PE | EV/EBITDA |
|---|---|---|---|---|---|
| UltraTech Cement | 3,04,617 | 85,775 | 19% | 39.2 | 20.2 |
| Ambuja Cements | 97,736 | 39,721 | 17% | 25.4 | 14.2 |
| Shree Cement | 82,036 | 20,374 | 23% | 45.8 | 16.0 |
| Dalmia Bharat | 32,641 | 14,650 | 20% | 27.3 | 11.4 |
| JSW Cement | 15,454 | 6,327 | 18% | 48.1 | 16.7 |
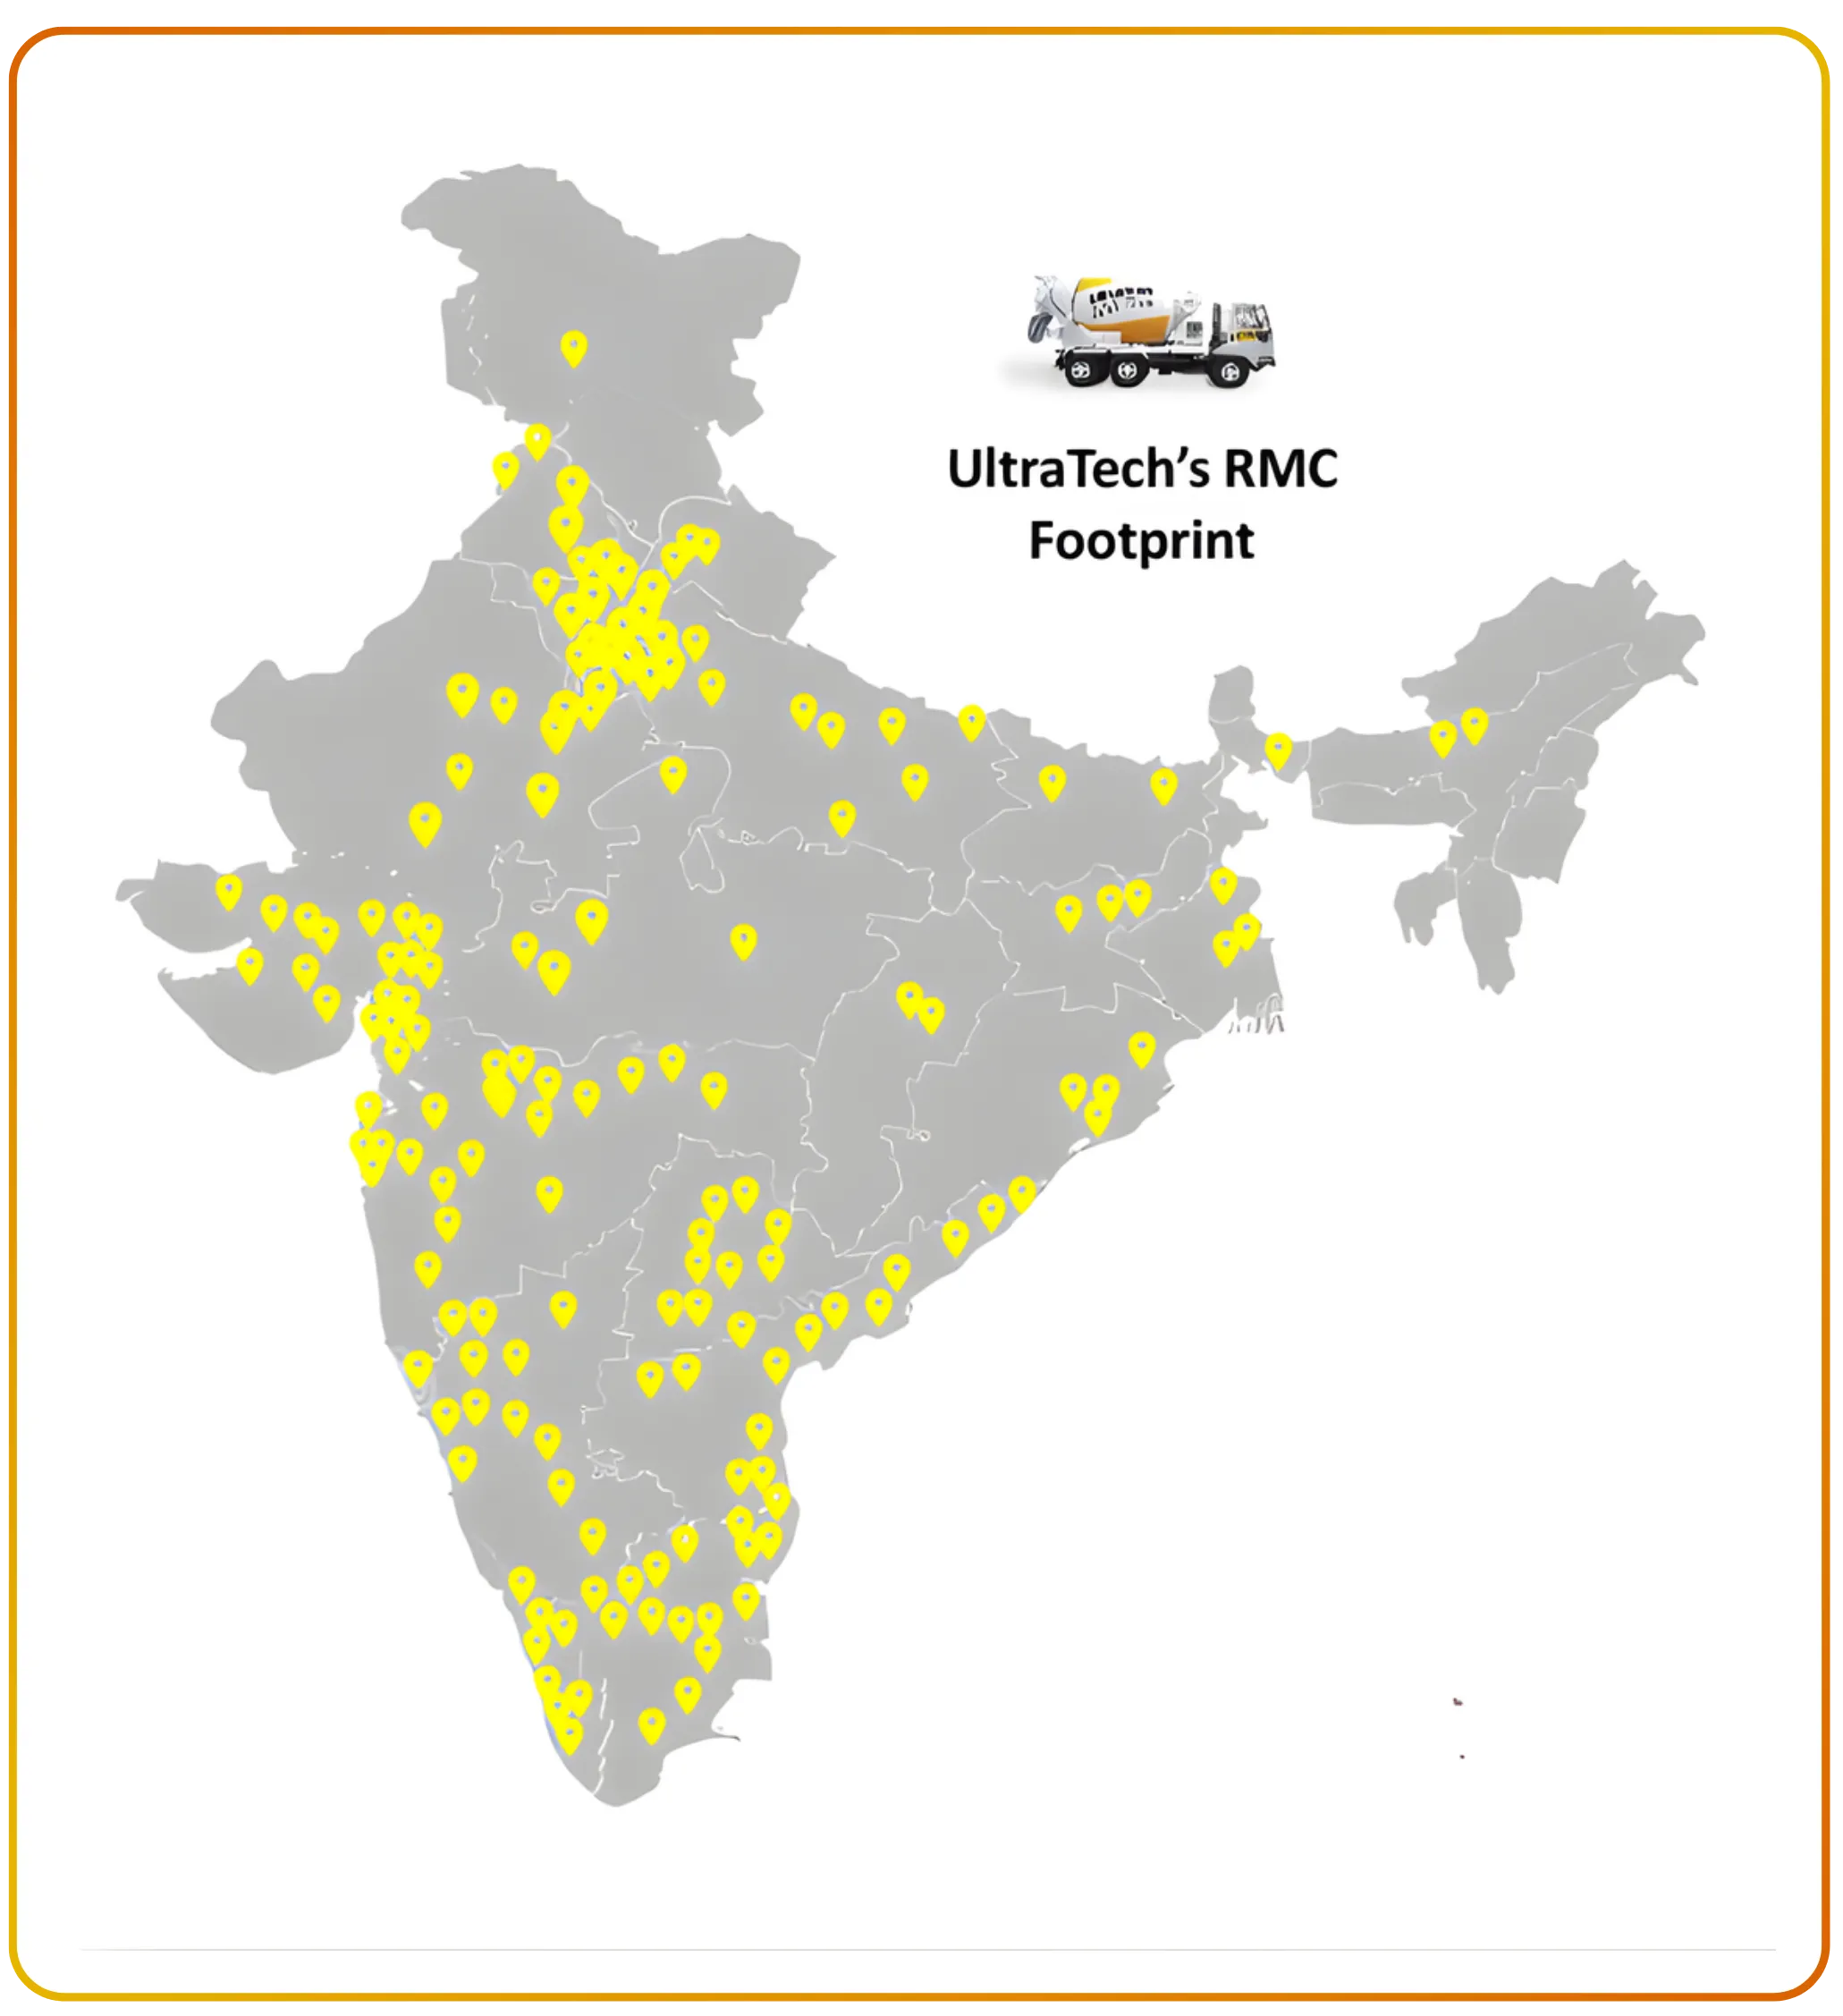
UltraTech Cement Limited: With a global UltraTech Cement capacity of nearly 155 million tonnes per annum, including approximately 150 million tonnes domestically, the company commands unmatched pricing influence across markets.. It exercises significant pricing power and market influence. The company recently solidified its leadership by acquiring India Cements Limited and the cement business of Kesoram Industries.
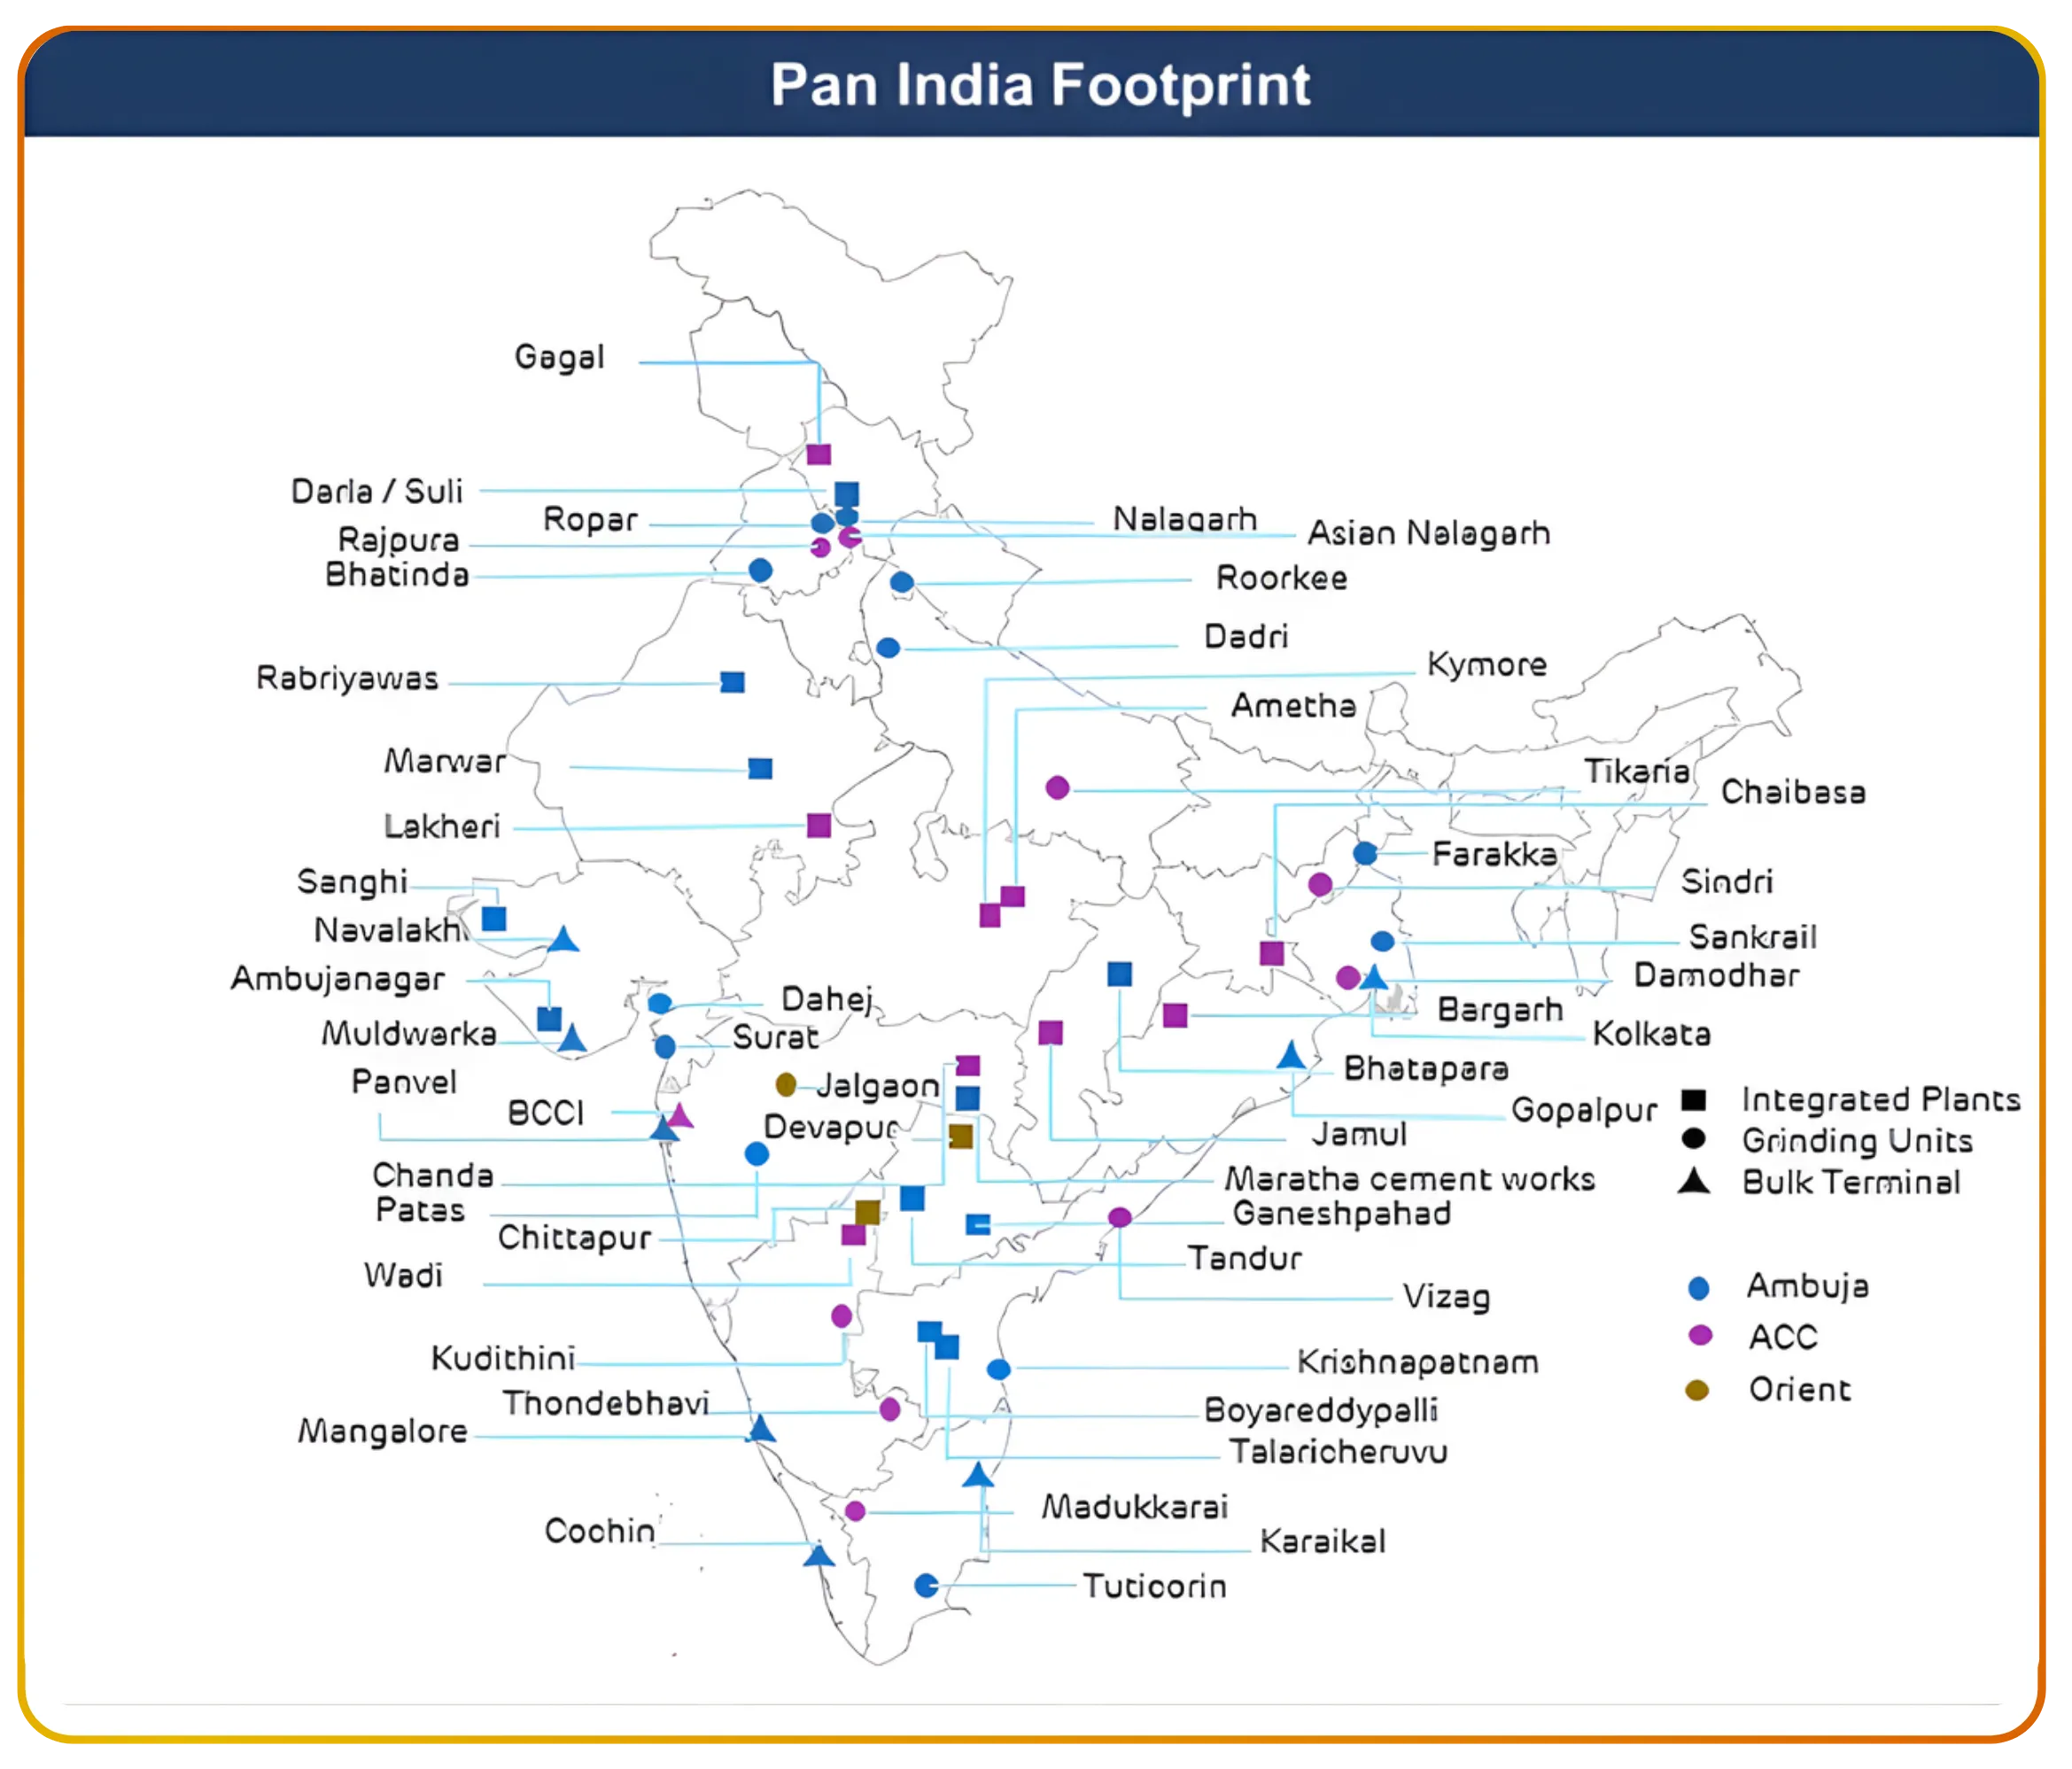
Ambuja Cements (Adani Group): Empowered by aggressive strategic acquisitions (including Orient Cement), the group is on a rapid expansion spree. Targeting an installed capacity of 140 million tonnes per annum by 2028, the company leverages group-level synergies in logistics and energy to drive operational efficiency.
Shree Cement Limited: Shree Cement has earned recognition as a low-cost cement producer in India, sustaining superior margins through disciplined control over logistics and energy expenditures. The company has focused predominantly on organic growth (expanding its footprint significantly in the East and South) and has heavily diversified into the Ready-Mix Concrete (RMC) segment.
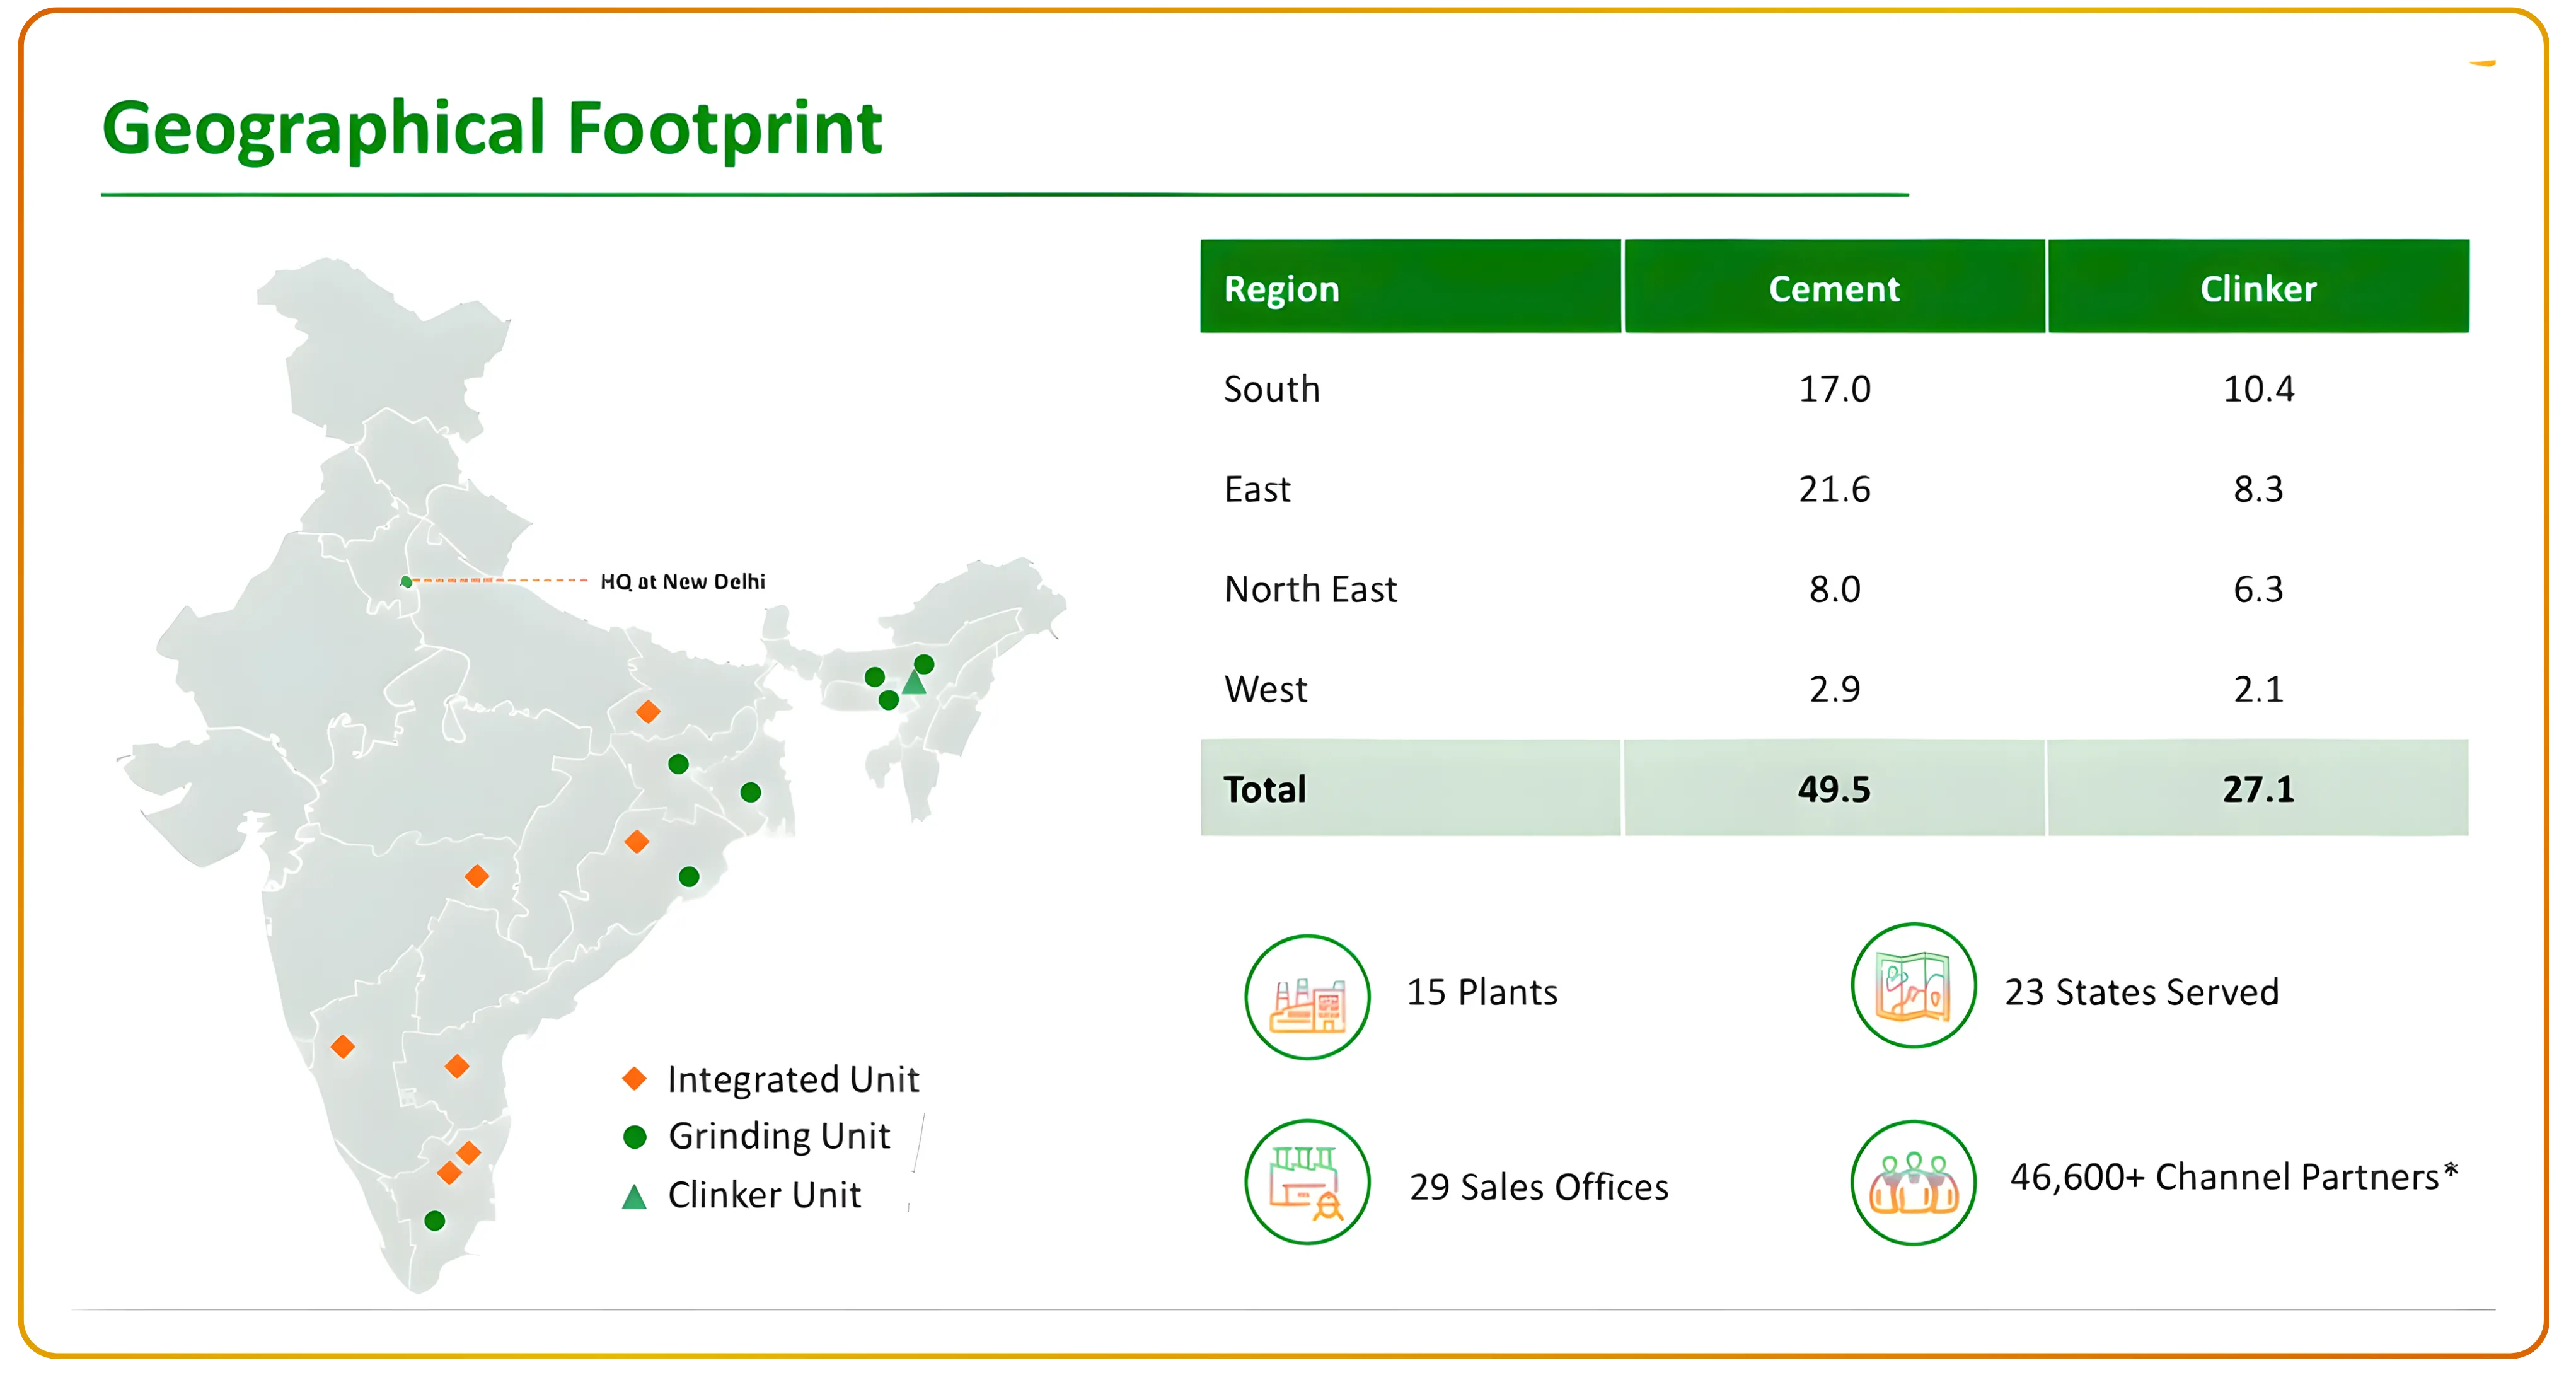
Dalmia Bharat Limited: The fourth largest player with an installed capacity of 49.5 million tonnes per annum, targeting 75 million tonnes by the financial year 2028. Dalmia Bharat leads the market in the highly lucrative North-East region, leveraging its first-mover advantage and strong distribution network to maintain premium pricing in that geography. With an 84% blending ratio for Portland Slag Cement, Dalmia has built one of the most differentiated cement blended product portfolios in the country. Its flagship offering, Portland Slag Cement, reflects a strong commitment to sustainable construction materials with a reduced carbon footprint.
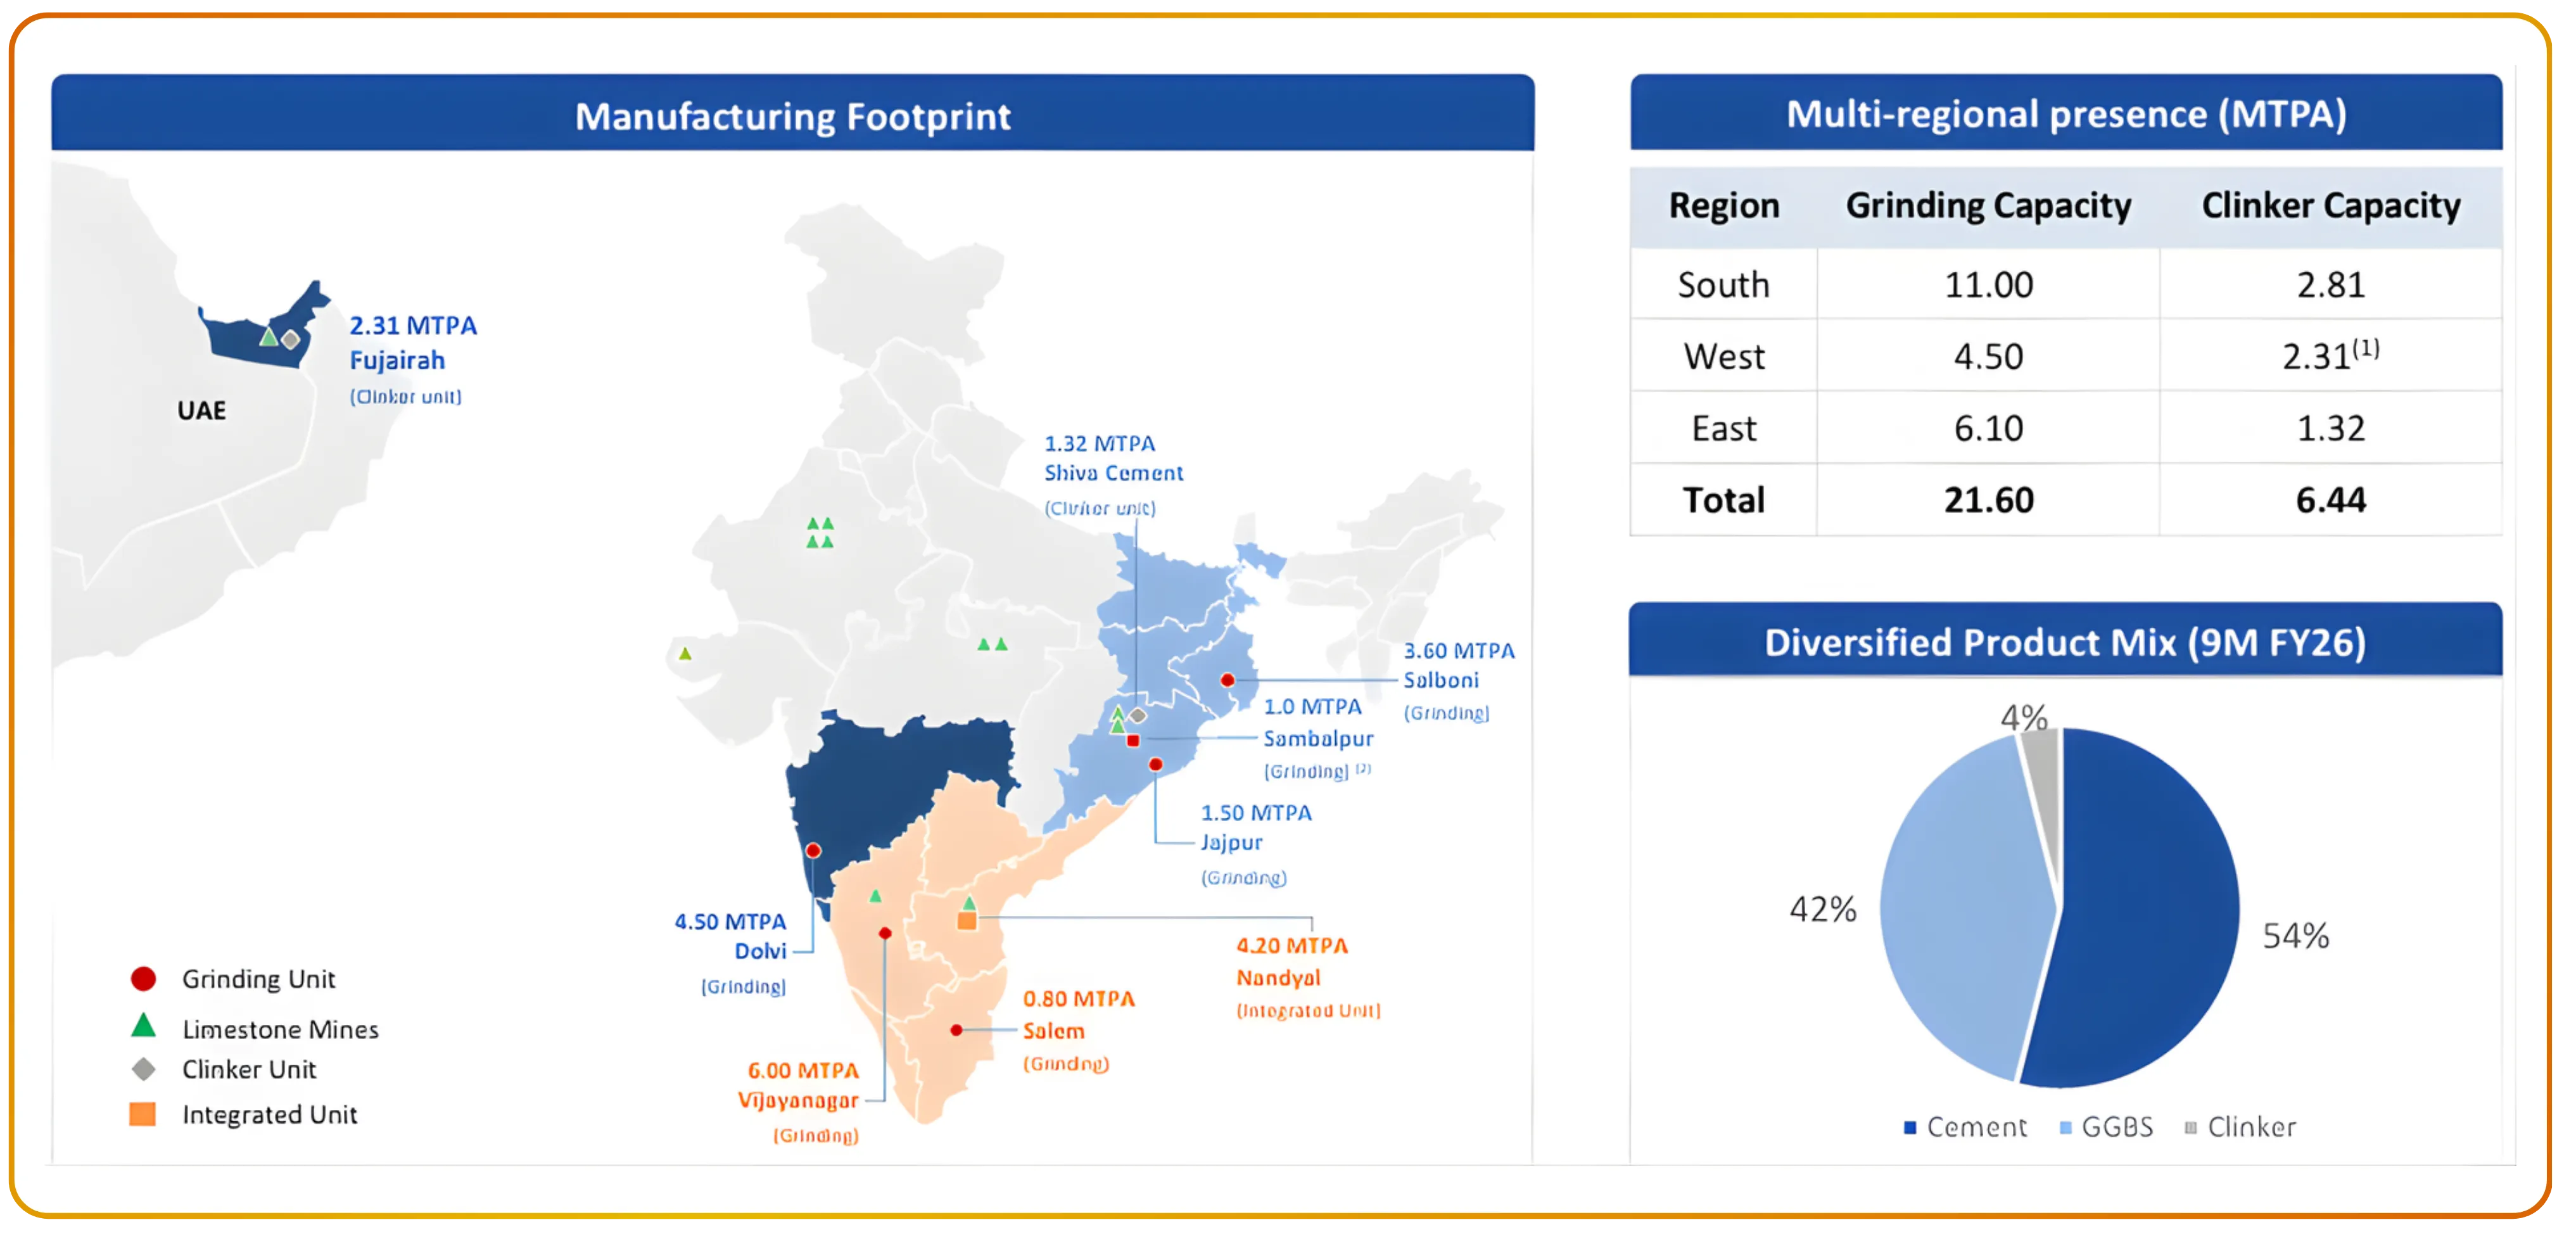
JSW Cement Limited: A fast-growing challenger with a current grinding capacity of approximately 20.6 million tonnes per annum (as of FY25), targeting 34.1 million tonnes per annum by FY28 (a capacity CAGR of approximately 13%, versus the industry average of nearly 5%). JSW Cement's GGBS operations give it a structurally differentiated position, commanding approximately 84% of the domestic GGBS market in India. As the largest GGBS manufacturer in India,JSW Cement's green cement portfolio (comprising Portland Slag Cement, Composite Cement, and GGBS) accounts for 77% of its total volumes sold. The company has emerged as the benchmark for green cement in India, with a CO₂ intensity that is approximately 52% below the peer group average. JSW Cement's carbon intensity of 258 kg CO₂ per tonne is the lowest among all cement manufacturers globally, setting a new standard for sustainable production.
For a parallel deep-dive into how structural tailwinds and embedded value play out at the company level, check out Analysing ITC Limited's Deep Value and Structural Growth.
Key Risks in the Cement Sector
| Risk Category | Severity | Description | Key Implication |
|---|---|---|---|
| Energy Price Volatility | High | Coal & petcoke account for ~30–35% of costs. Global price shocks directly impact margins. WHR and renewables offer partial cushioning, but ~70–75% dependency on fossil fuels remains. |
Margin pressure during commodity spikes |
| Overcapacity / Pricing Pressure | High | Capacity expected to reach ~850 MTPA by 2030 vs demand of ~440–470 MT. Utilisation remains ~70–71%. Southern region already faces oversupply. |
Weak pricing power and lower realizations |
| Cyclicality & Demand Shocks | High | Demand linked to elections, monsoon, and macro cycles. H1FY25 saw muted demand due to elections and weather disruptions. |
Volume volatility and unpredictable growth |
| Capex Overhang / Leverage | Medium | Aggressive expansion by major players (e.g., Ambuja, JSW) leading to sustained capex cycles over next 3–5 years. | Pressure on free cash flow and balance sheets |
| Regional Market Fragmentation | Medium | Cement is a regional product due to high logistics costs. South India remains oversupplied; pricing power varies across regions. |
Uneven profitability across geographies |
| Government Capex Slowdown Risk | Low–Medium | Infrastructure contributes ~24–25% of demand. Any slowdown in government spending can impact demand growth. |
Direct hit on the fastest-growing demand segment |
Cement Long-Term Outlook: India's Secular Growth Story
The cement long-term outlook in India remains firmly positive, underpinned by demographic shifts, rapid urbanization, and a sustained government mandate for infrastructure modernization. While near-term overcapacity and fuel price volatility will create quarterly noise, the structural cement industry outlook (aided by consolidation and efficiency gains) remains exceedingly strong for long-term investors. The industry is highly investible for both institutional and long-term participants seeking exposure to India's broader economic rise.
Disclaimer: The information provided in our blogs is for informational purposes only and should not be construed as financial, investment, or trading advice. Trading and investing in the securities market carries risk. Always conduct your own research and consult with a qualified financial advisor before making any investment decisions. Past performance is not indicative of future results. Copyrighted and original content for your trading and investing needs.
© 2026 — Tradejini. All Rights Reserved.


