







Imagine you are standing outside a cricket stadium, and you want to know which team the crowd thinks will win. You don't ask the scoreboard; scores can be misleading early in the game. Instead, you watch where people are placing their bets at the gate. If nine out of ten people are backing Team A, that tells you something powerful about collective expectation.
Open Interest Change in options trading works the same way. It tells you where market participants (from large institutions to seasoned traders) are placing their bets right now. And on NXTOption, the OI Stats → OI Change / OI feature gives you a live, visual window into exactly this information, sliced by strike price, by time bucket, by expiry date, and more.
This guide walks you through every part of that feature, explains what it means in plain language, and shows how traders use it to make sharper decisions.
What is Open Interest, and Why Does It Matter?
Before we get into the feature, let's get the basics right. Open Interest (OI) is simply the total number of active options contracts that have not yet been settled.
Simple Definition: If you buy a NIFTY 24000 Call option and nobody has sold it to you from their existing position, a brand new contract is created. That contract adds 1 to the Open Interest count. OI goes up when new money enters the market, and goes down when positions are closed.
Why should you care? Because OI is a measure of commitment. High OI at a particular strike means a lot of traders have taken a serious position there. That level tends to act as a magnet, or a wall for the price.
OI Change (the focus of this article) takes this one step further. Instead of showing total positions, it shows how much OI grew or shrank in a chosen time window. That's the difference between a photograph and a video. The change tells you the direction of money flow in real time.
What is the OI Change Feature on NXTOption?
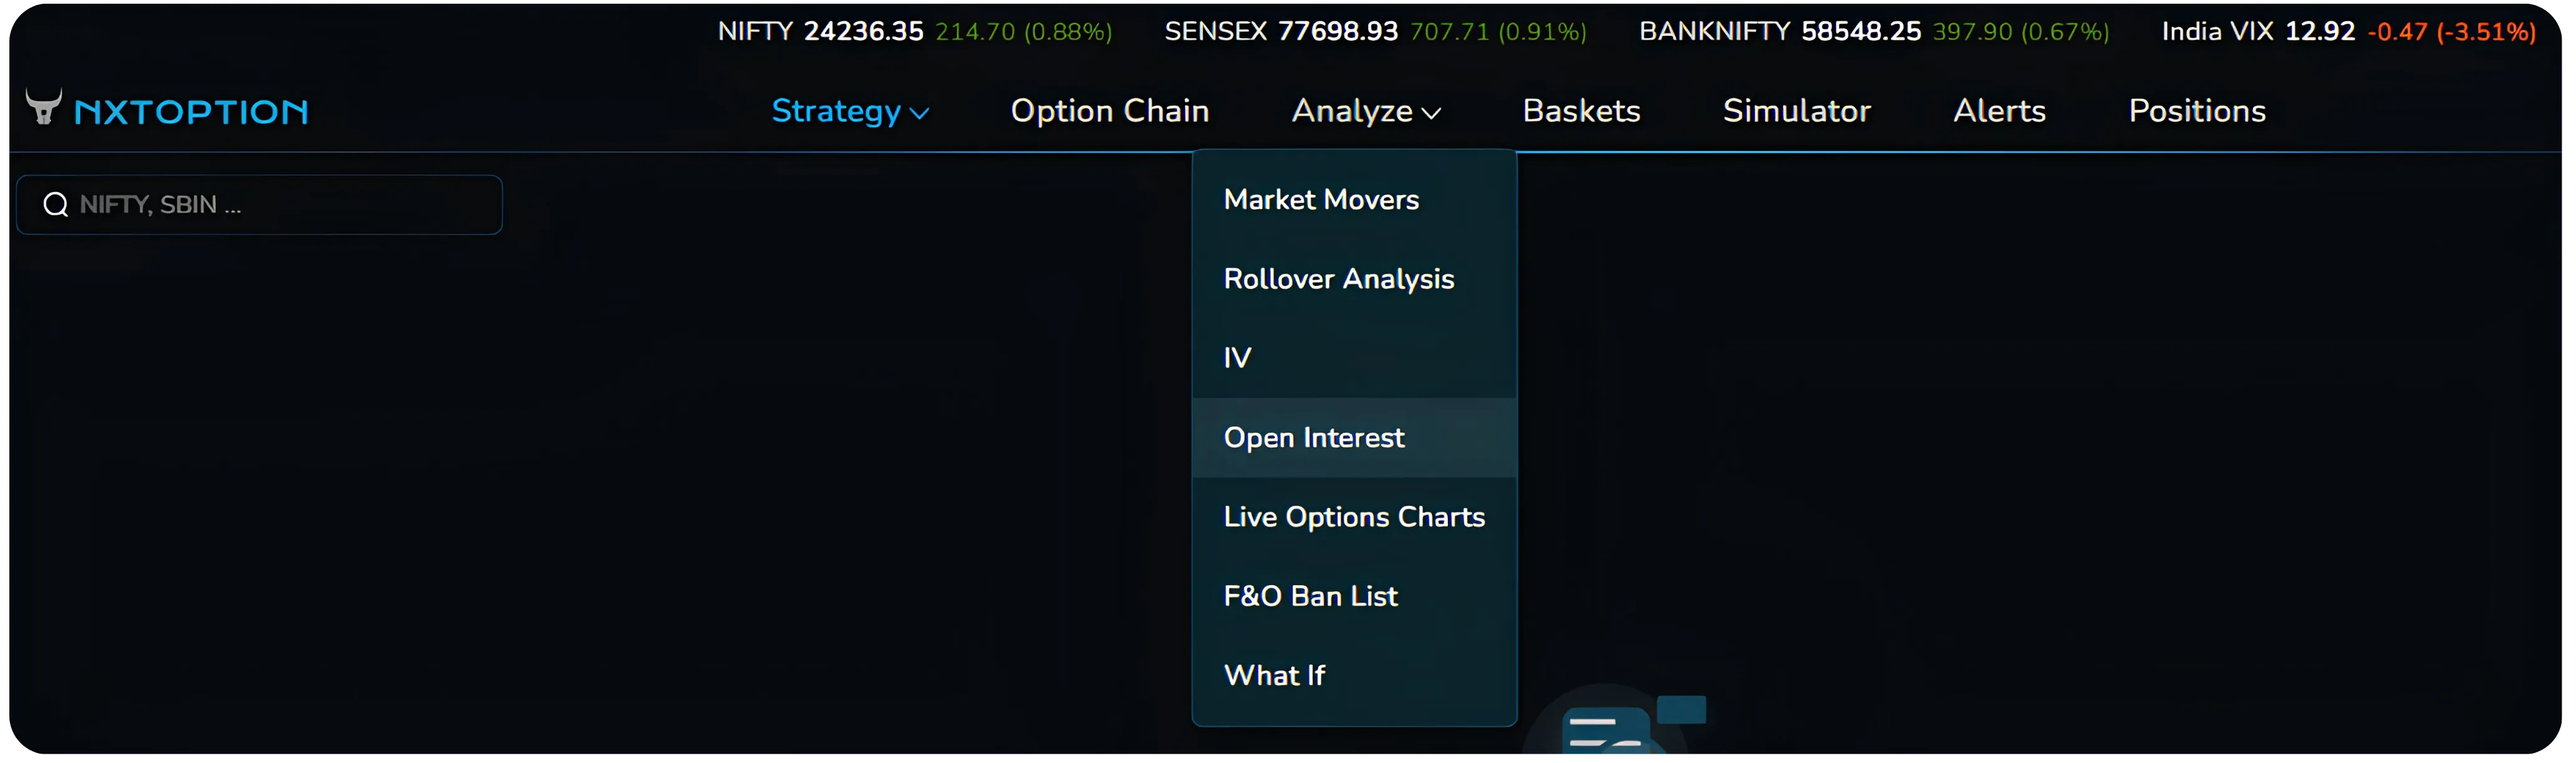
On the NXTOption platform, navigate to OI Stats → OI Change / OI. By default, it opens the OI Change view. You will see:
A bar chart showing Call OI Change (red bars) and Put OI Change (green bars) across different strike prices
A small Cumulative OI Change summary panel on the left showing total Call vs Put build-up for the day
A PCR (Put-Call Ratio) number in the top right
Filters for Strike Range, Expiry Dates, and Number of Strikes to display
Time bucket selector at the bottom for controlling the time window of the data
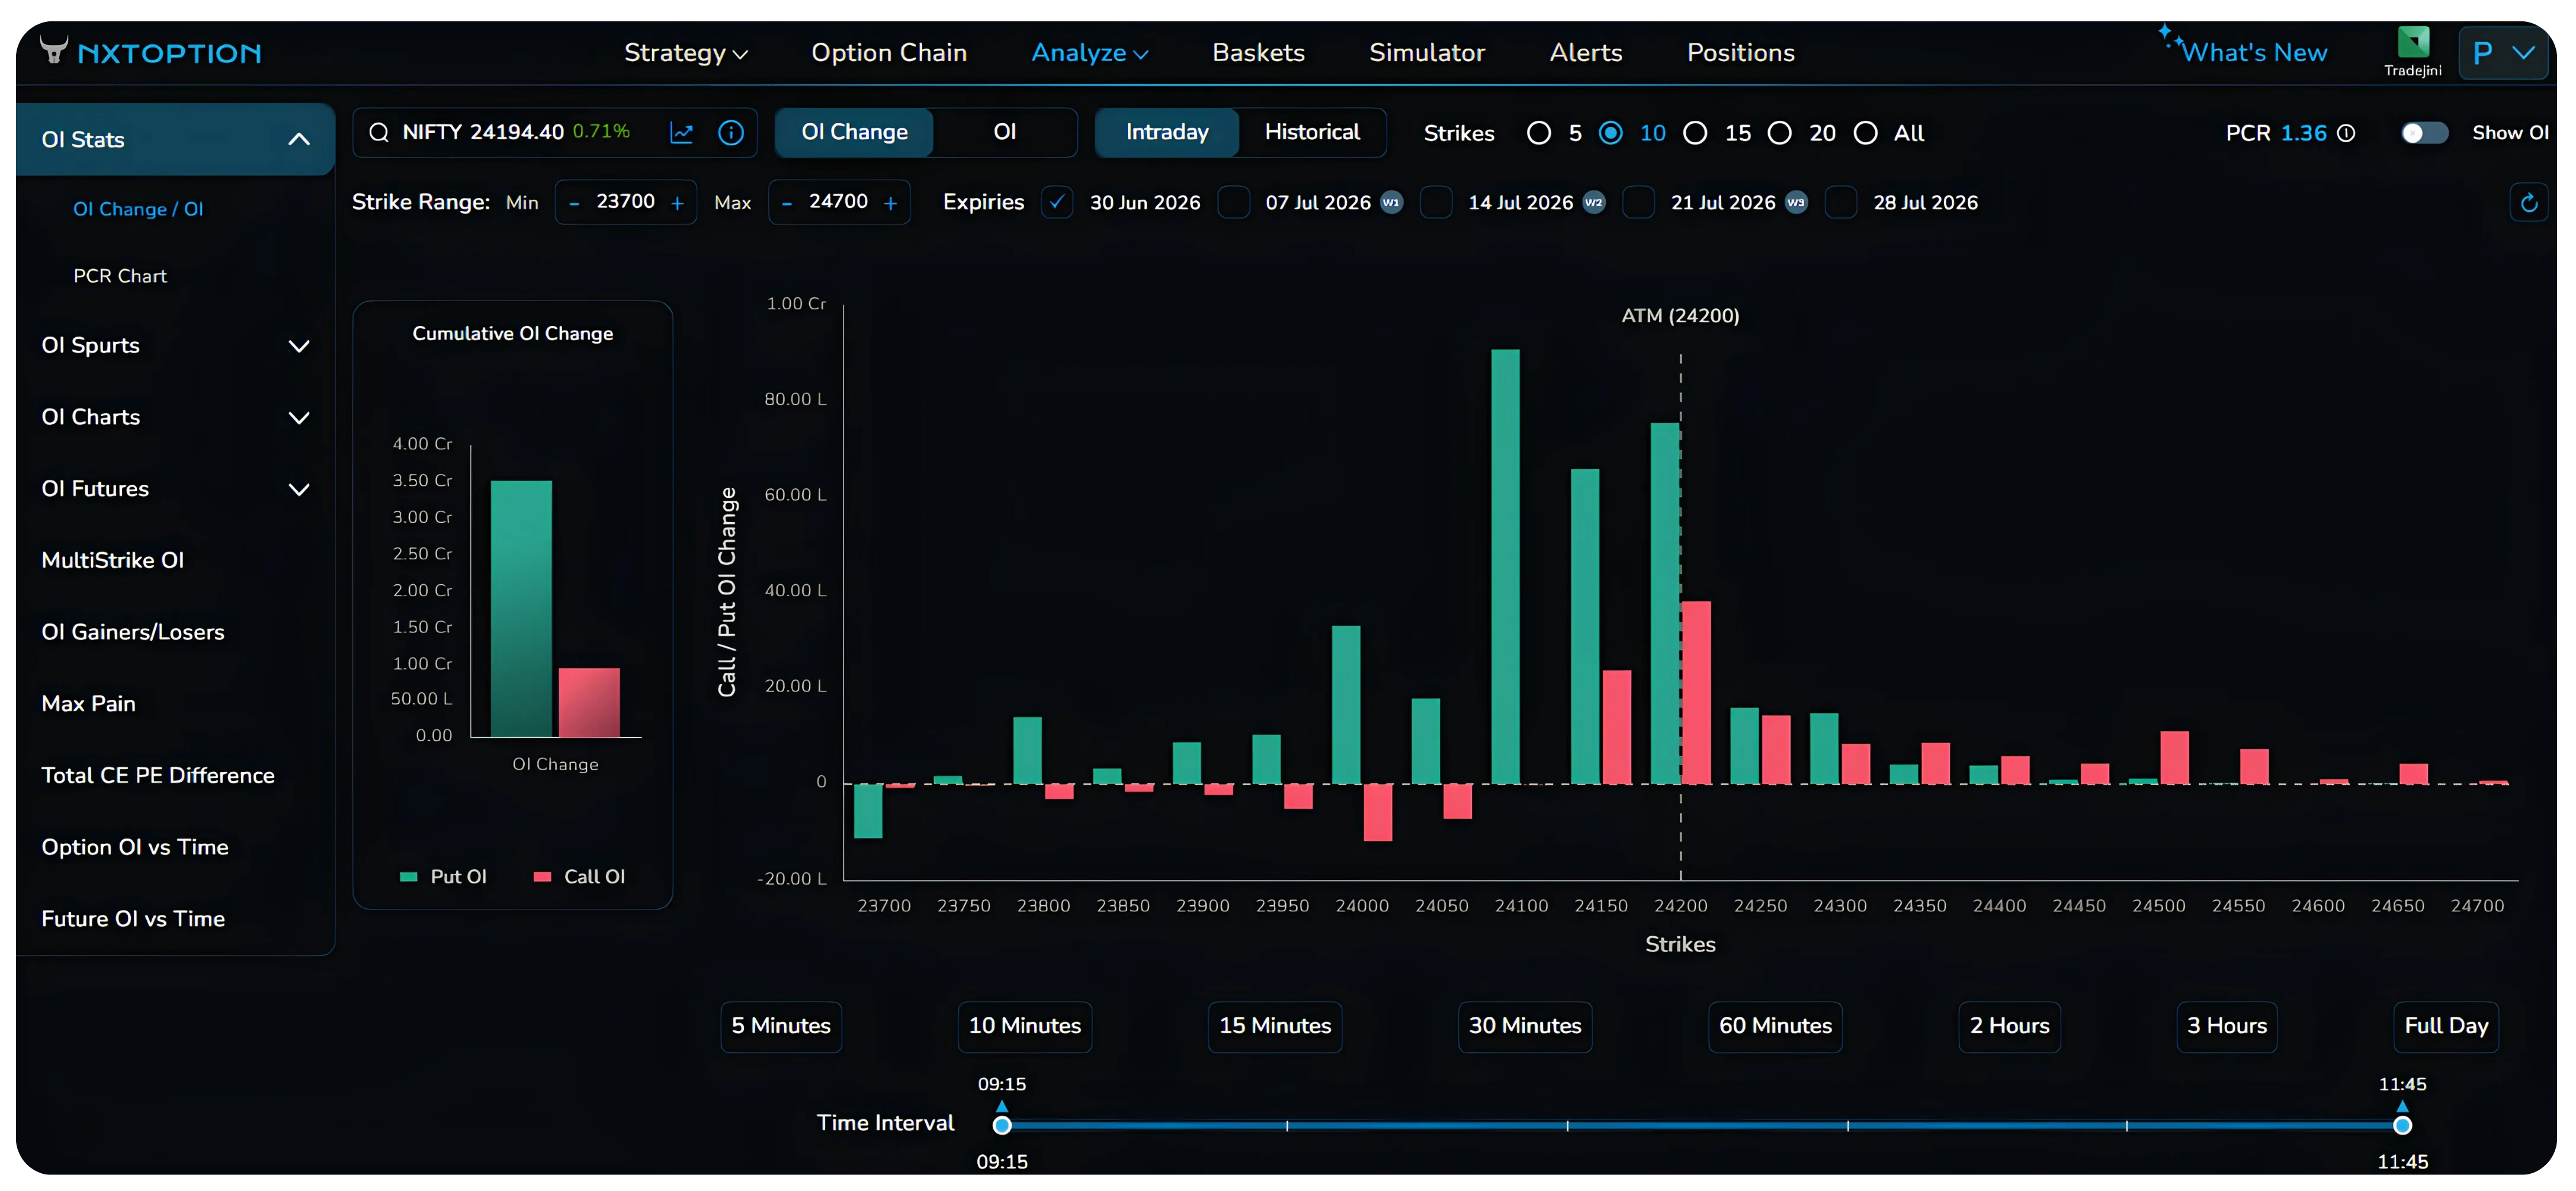
You can also toggle to the OI view (showing absolute OI levels rather than change), but the OI Change view is where the real intraday action is visible.
How to Read the OI Change Chart
The chart has strike prices on the X-axis (horizontal) and the quantity of OI change on the Y-axis (vertical). Two types of bars appear side by side at each strike:
| Bar Colour | What It Represents | What It Signals |
|---|---|---|
| Green | Put Open Interest (OI) Change at that strike | Traders are writing (selling) puts, indicating they expect the market to stay above this level. This strike often acts as a support zone. |
| Red | Call Open Interest (OI) Change at that strike | Traders are writing (selling) calls, indicating they expect the market to stay below this level. This strike often acts as a resistance zone. |
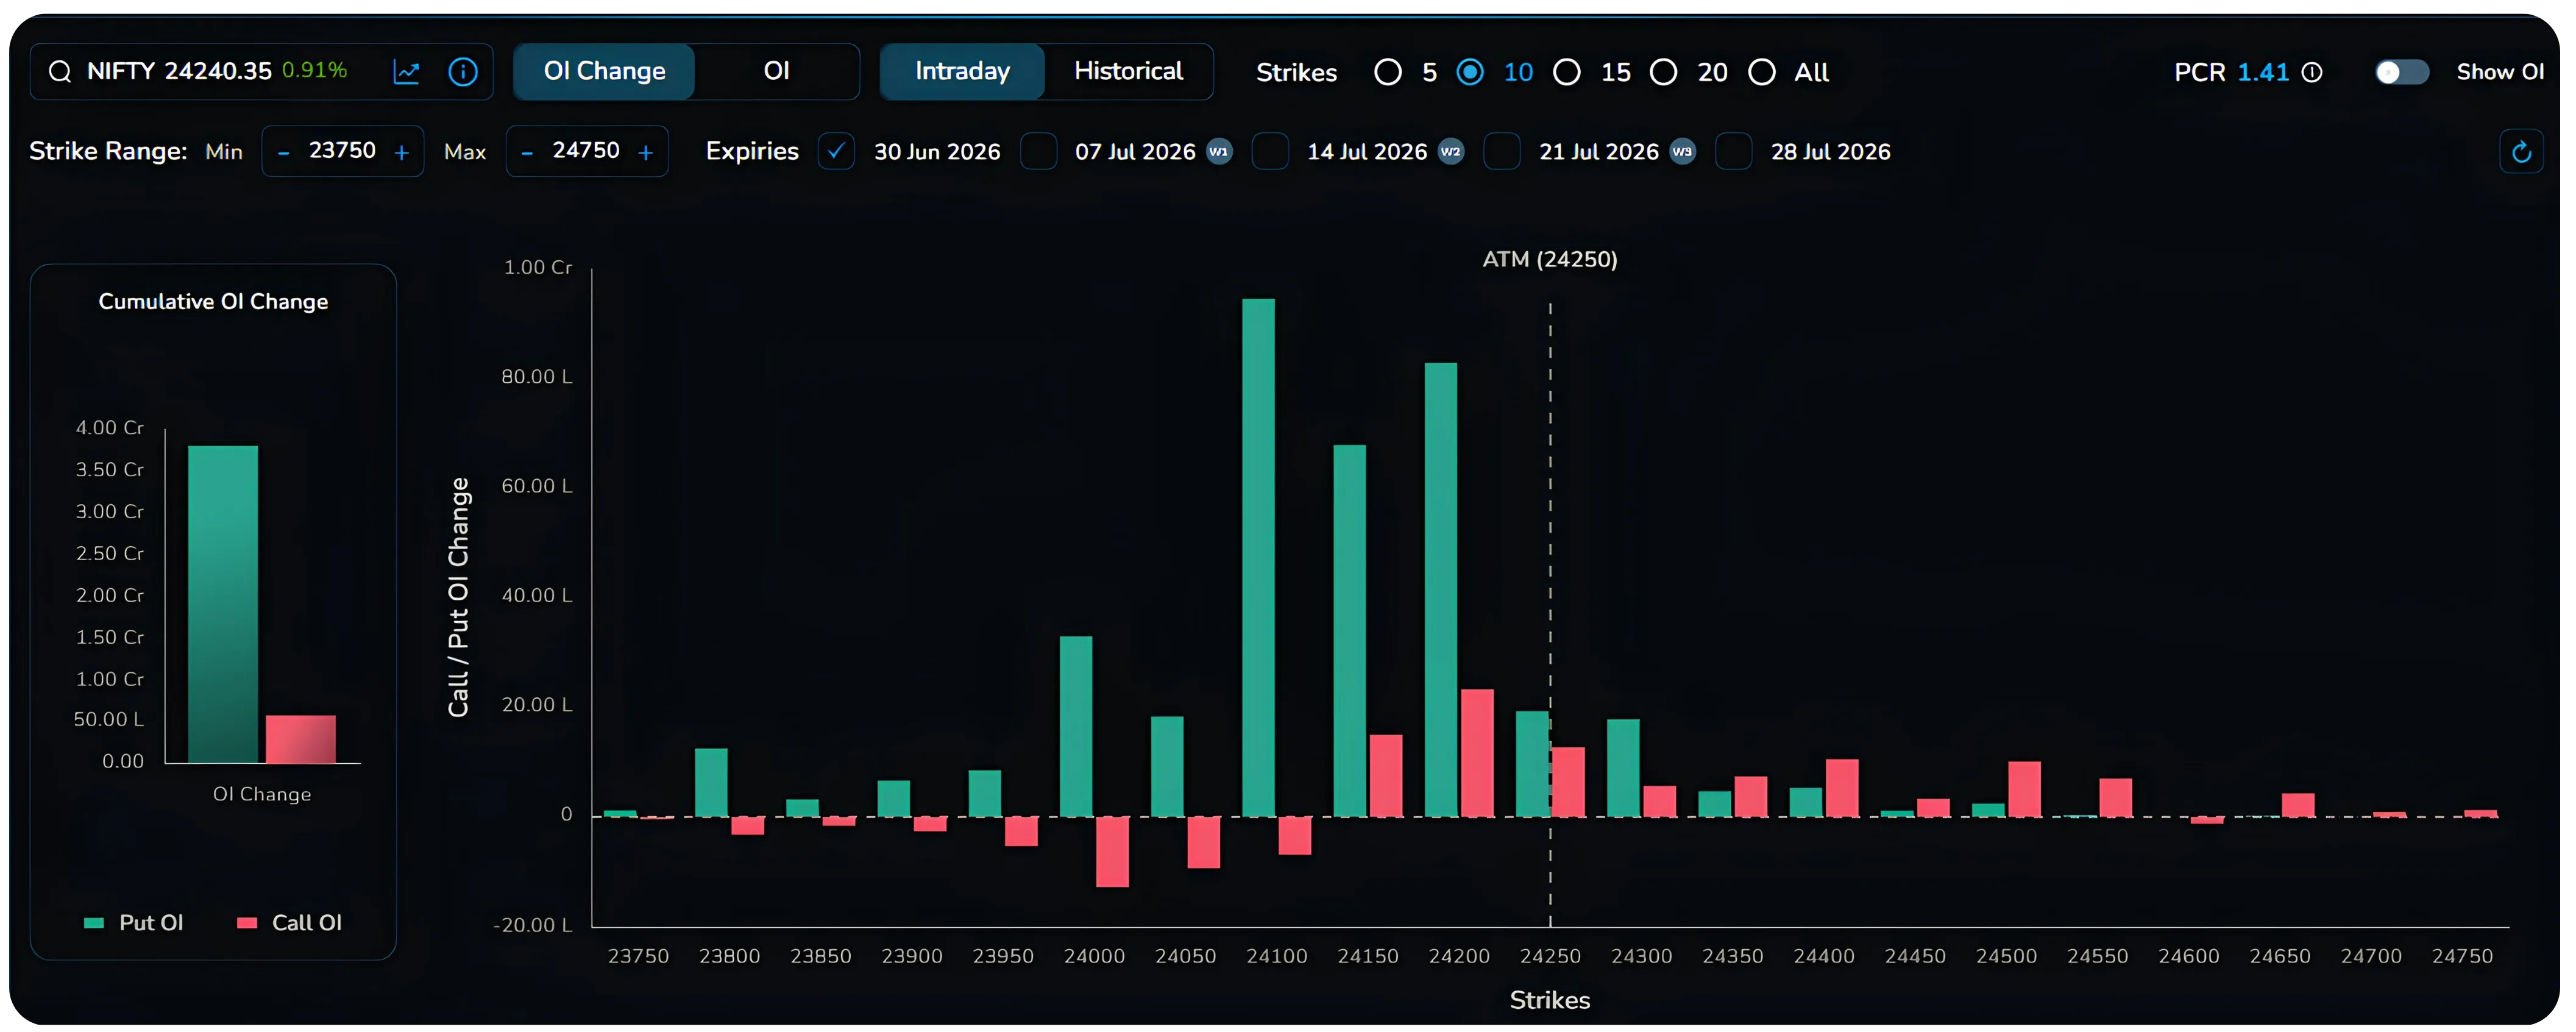
A vertical dashed line marks the ATM (At-The-Money) strike; the strike closest to the current market price. In the image, you can see ATM marked at 24250, which is close to NIFTY trading at 24240.
What does it look like when there is strong support?
A large green bar at a strike means Put writers are actively building positions there. They are betting the market will not fall below that level, and they are putting money on that belief. The larger the green bar, the stronger the support signal from options writers.
What does it look like when there is strong resistance?
A large red bar at a strike means Call writers are building there. They are betting the market won't cross that level. A dominant red bar above the current price is a wall the market has to break through.
Example from the Image:
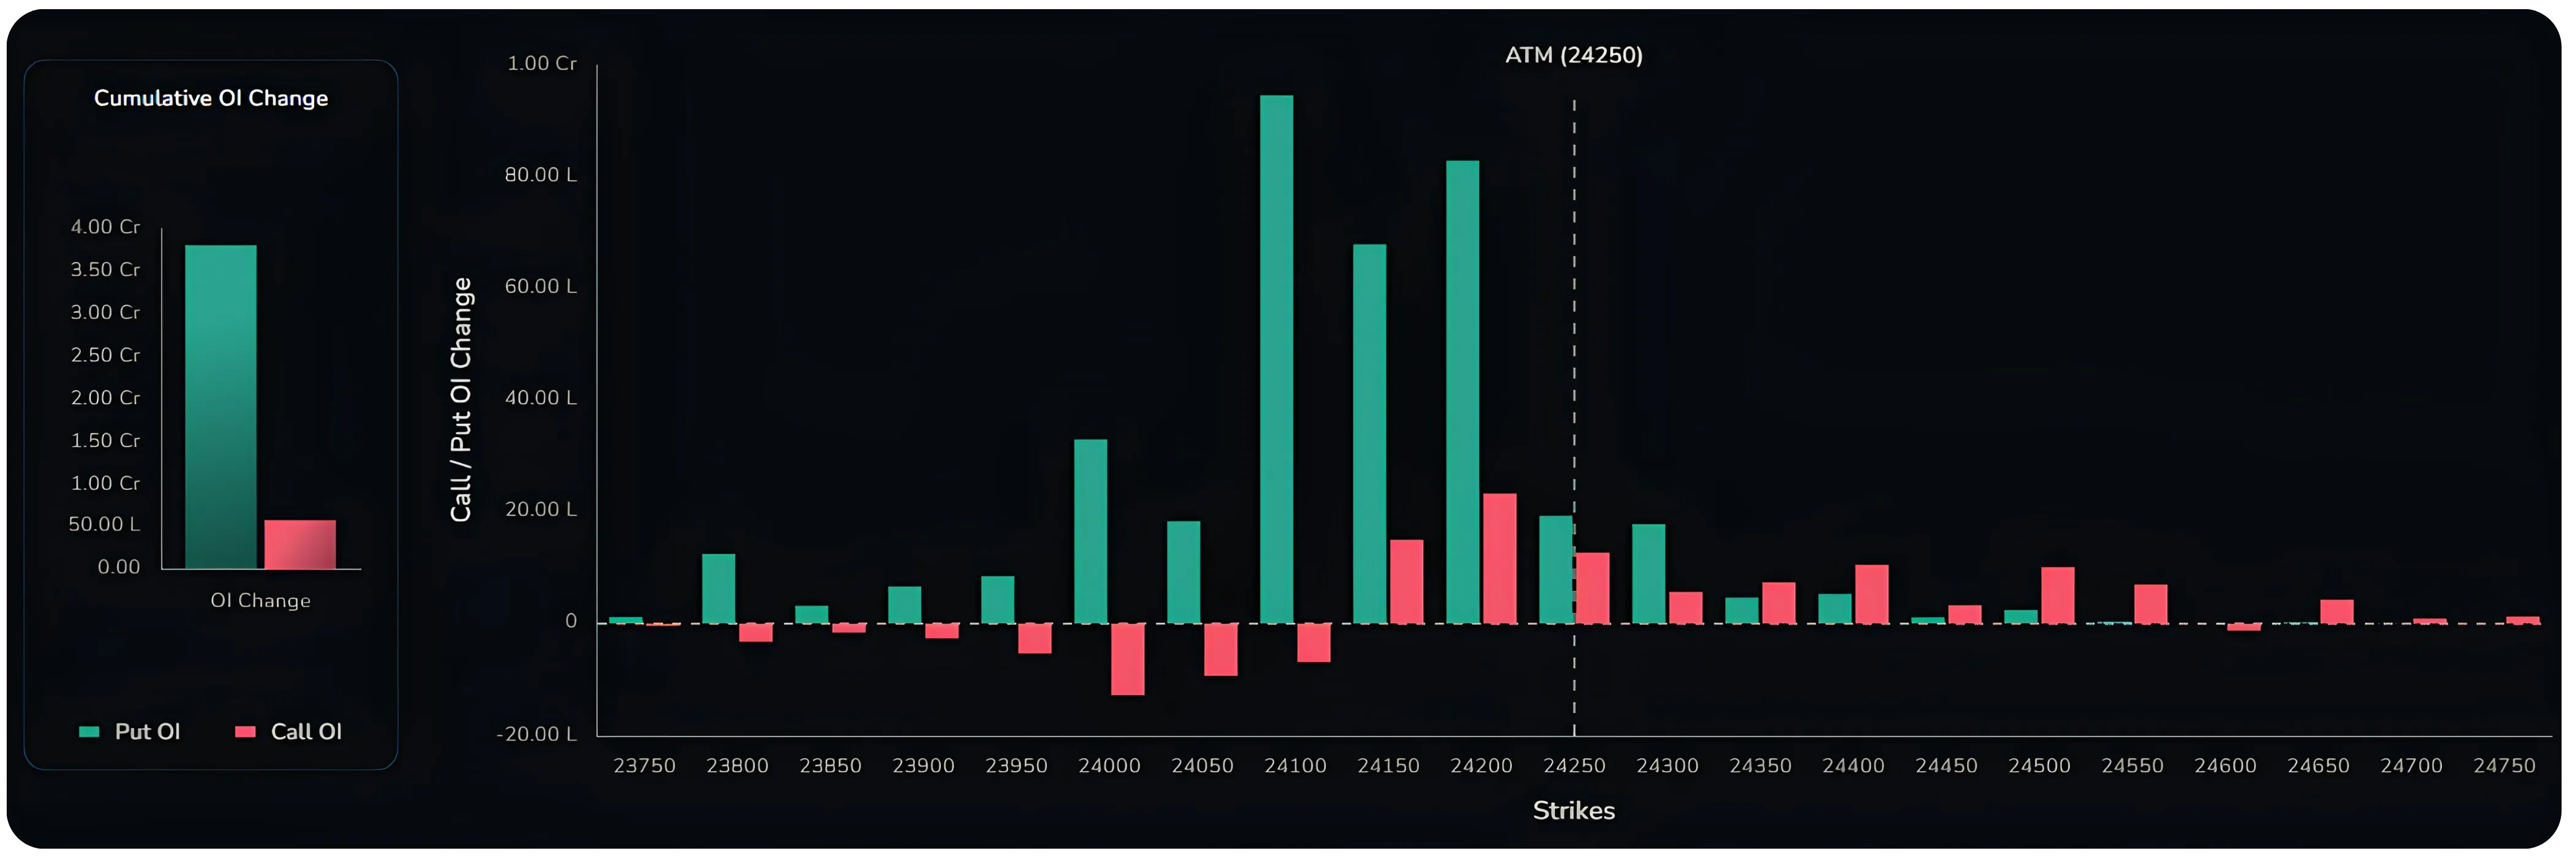
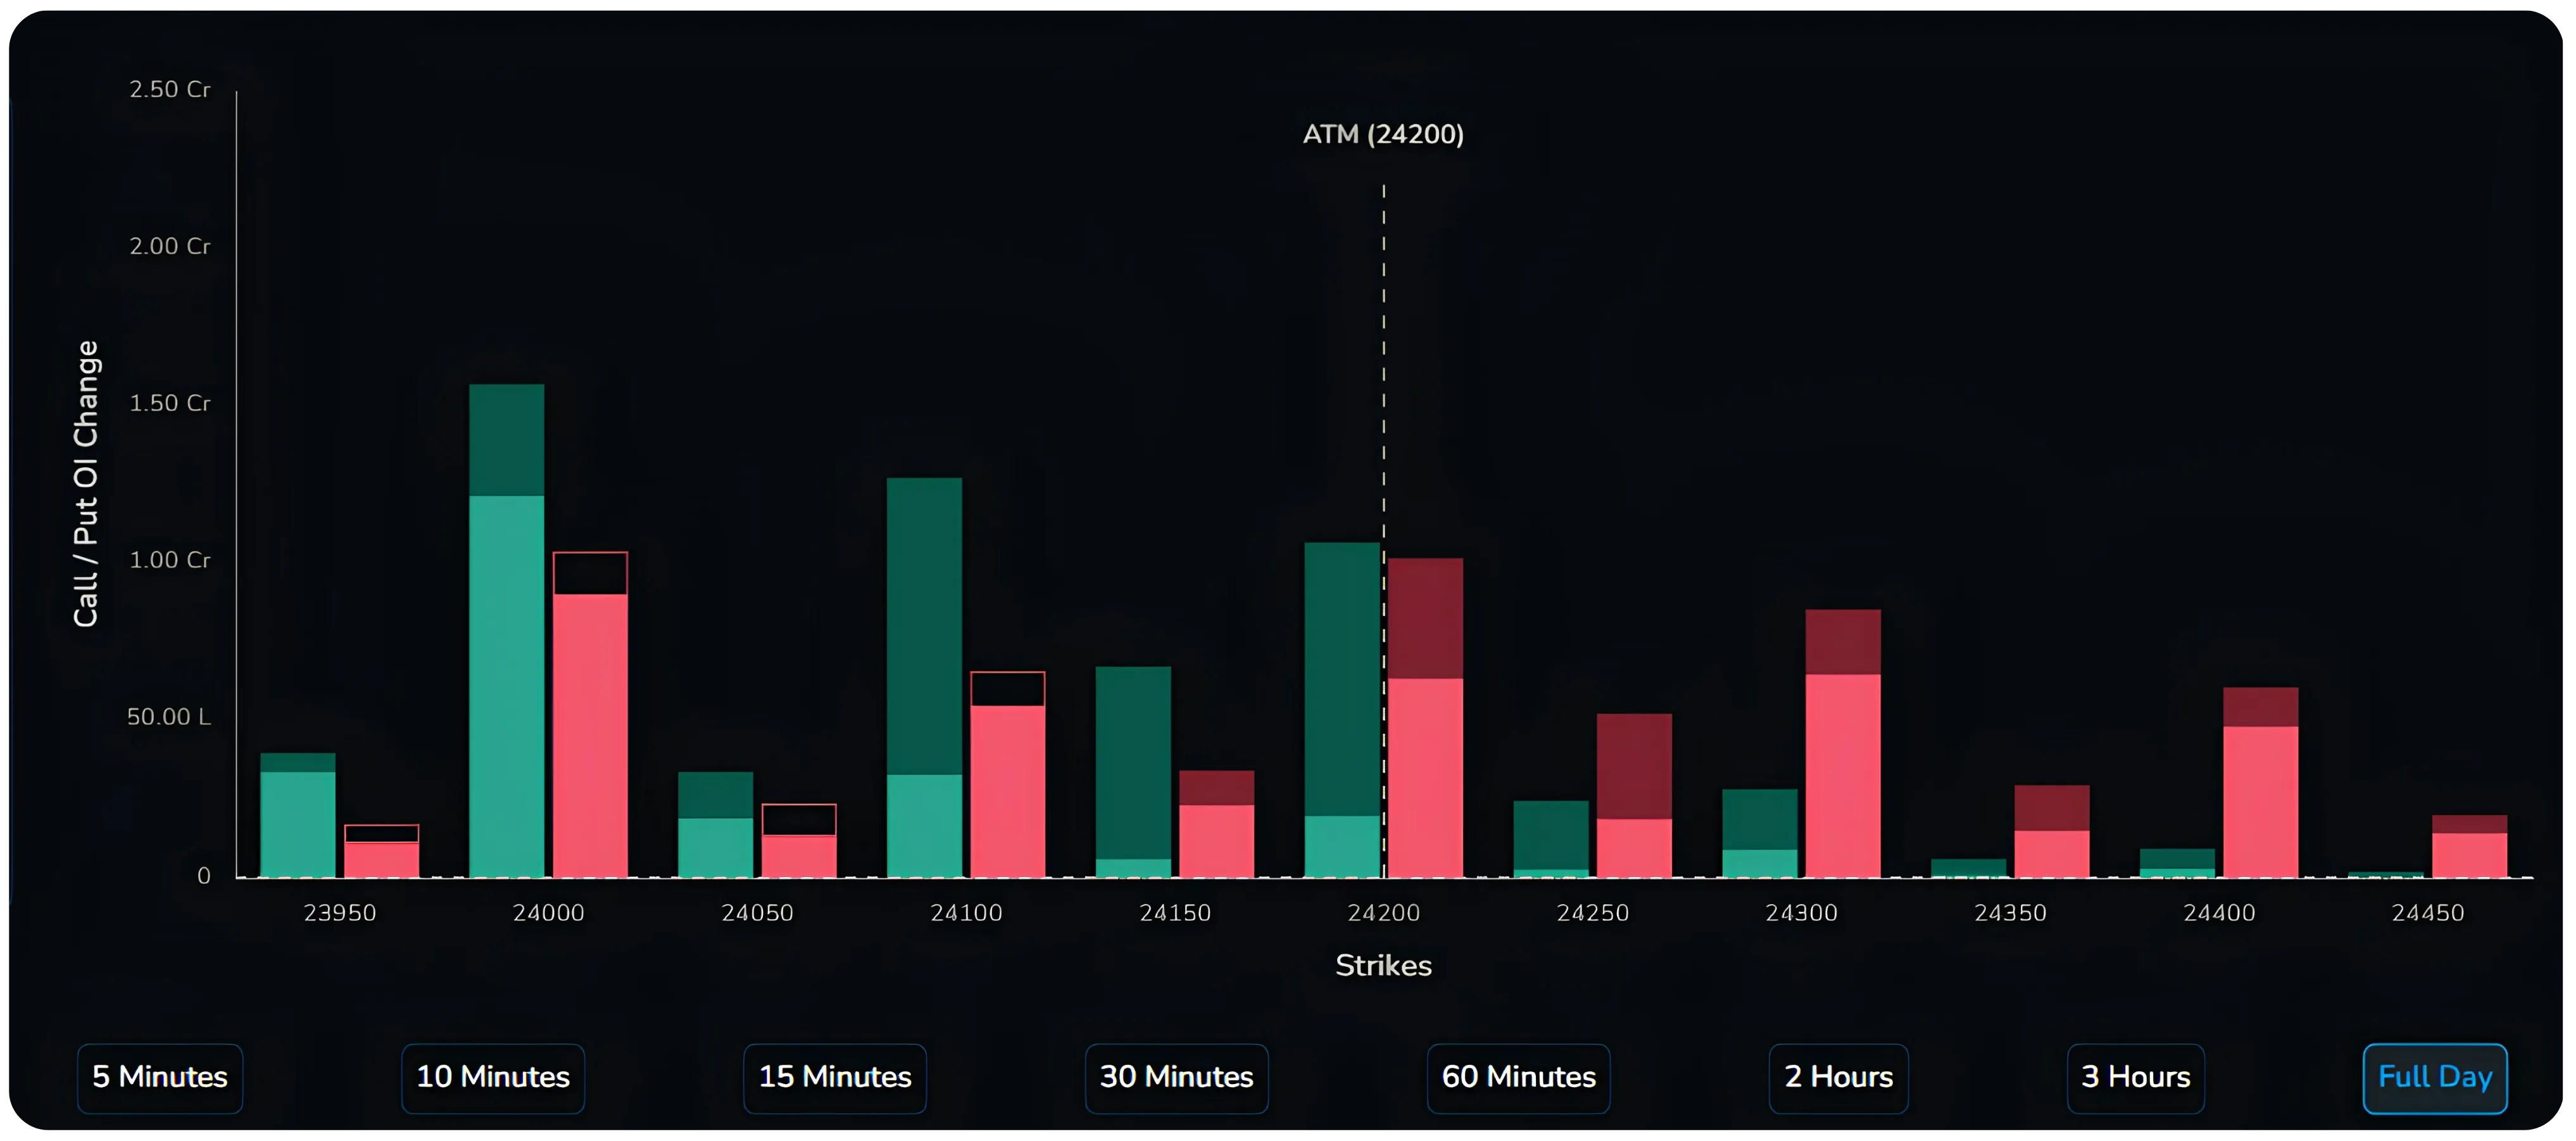
The 24100 strike shows the largest green (Put) bar in the chart, with nearly 0.95 Cr contracts of Put OI addition. This indicates that, at the time of the snapshot, traders were aggressively writing puts at 24100, making it the strongest intraday support level. The 24200 strike also recorded significant Put writing, reinforcing the support zone around 24100 to 24200. On the Call side, the 24200 strike has the largest red (Call) bar, signalling the strongest intraday resistance, with additional Call writing visible at 24150 and 24250. Together, the data suggests the market was expected to remain within the 24100 to 24200 range unless fresh buying or selling momentum emerged.
The Time Bucket: Your Most Powerful Filter
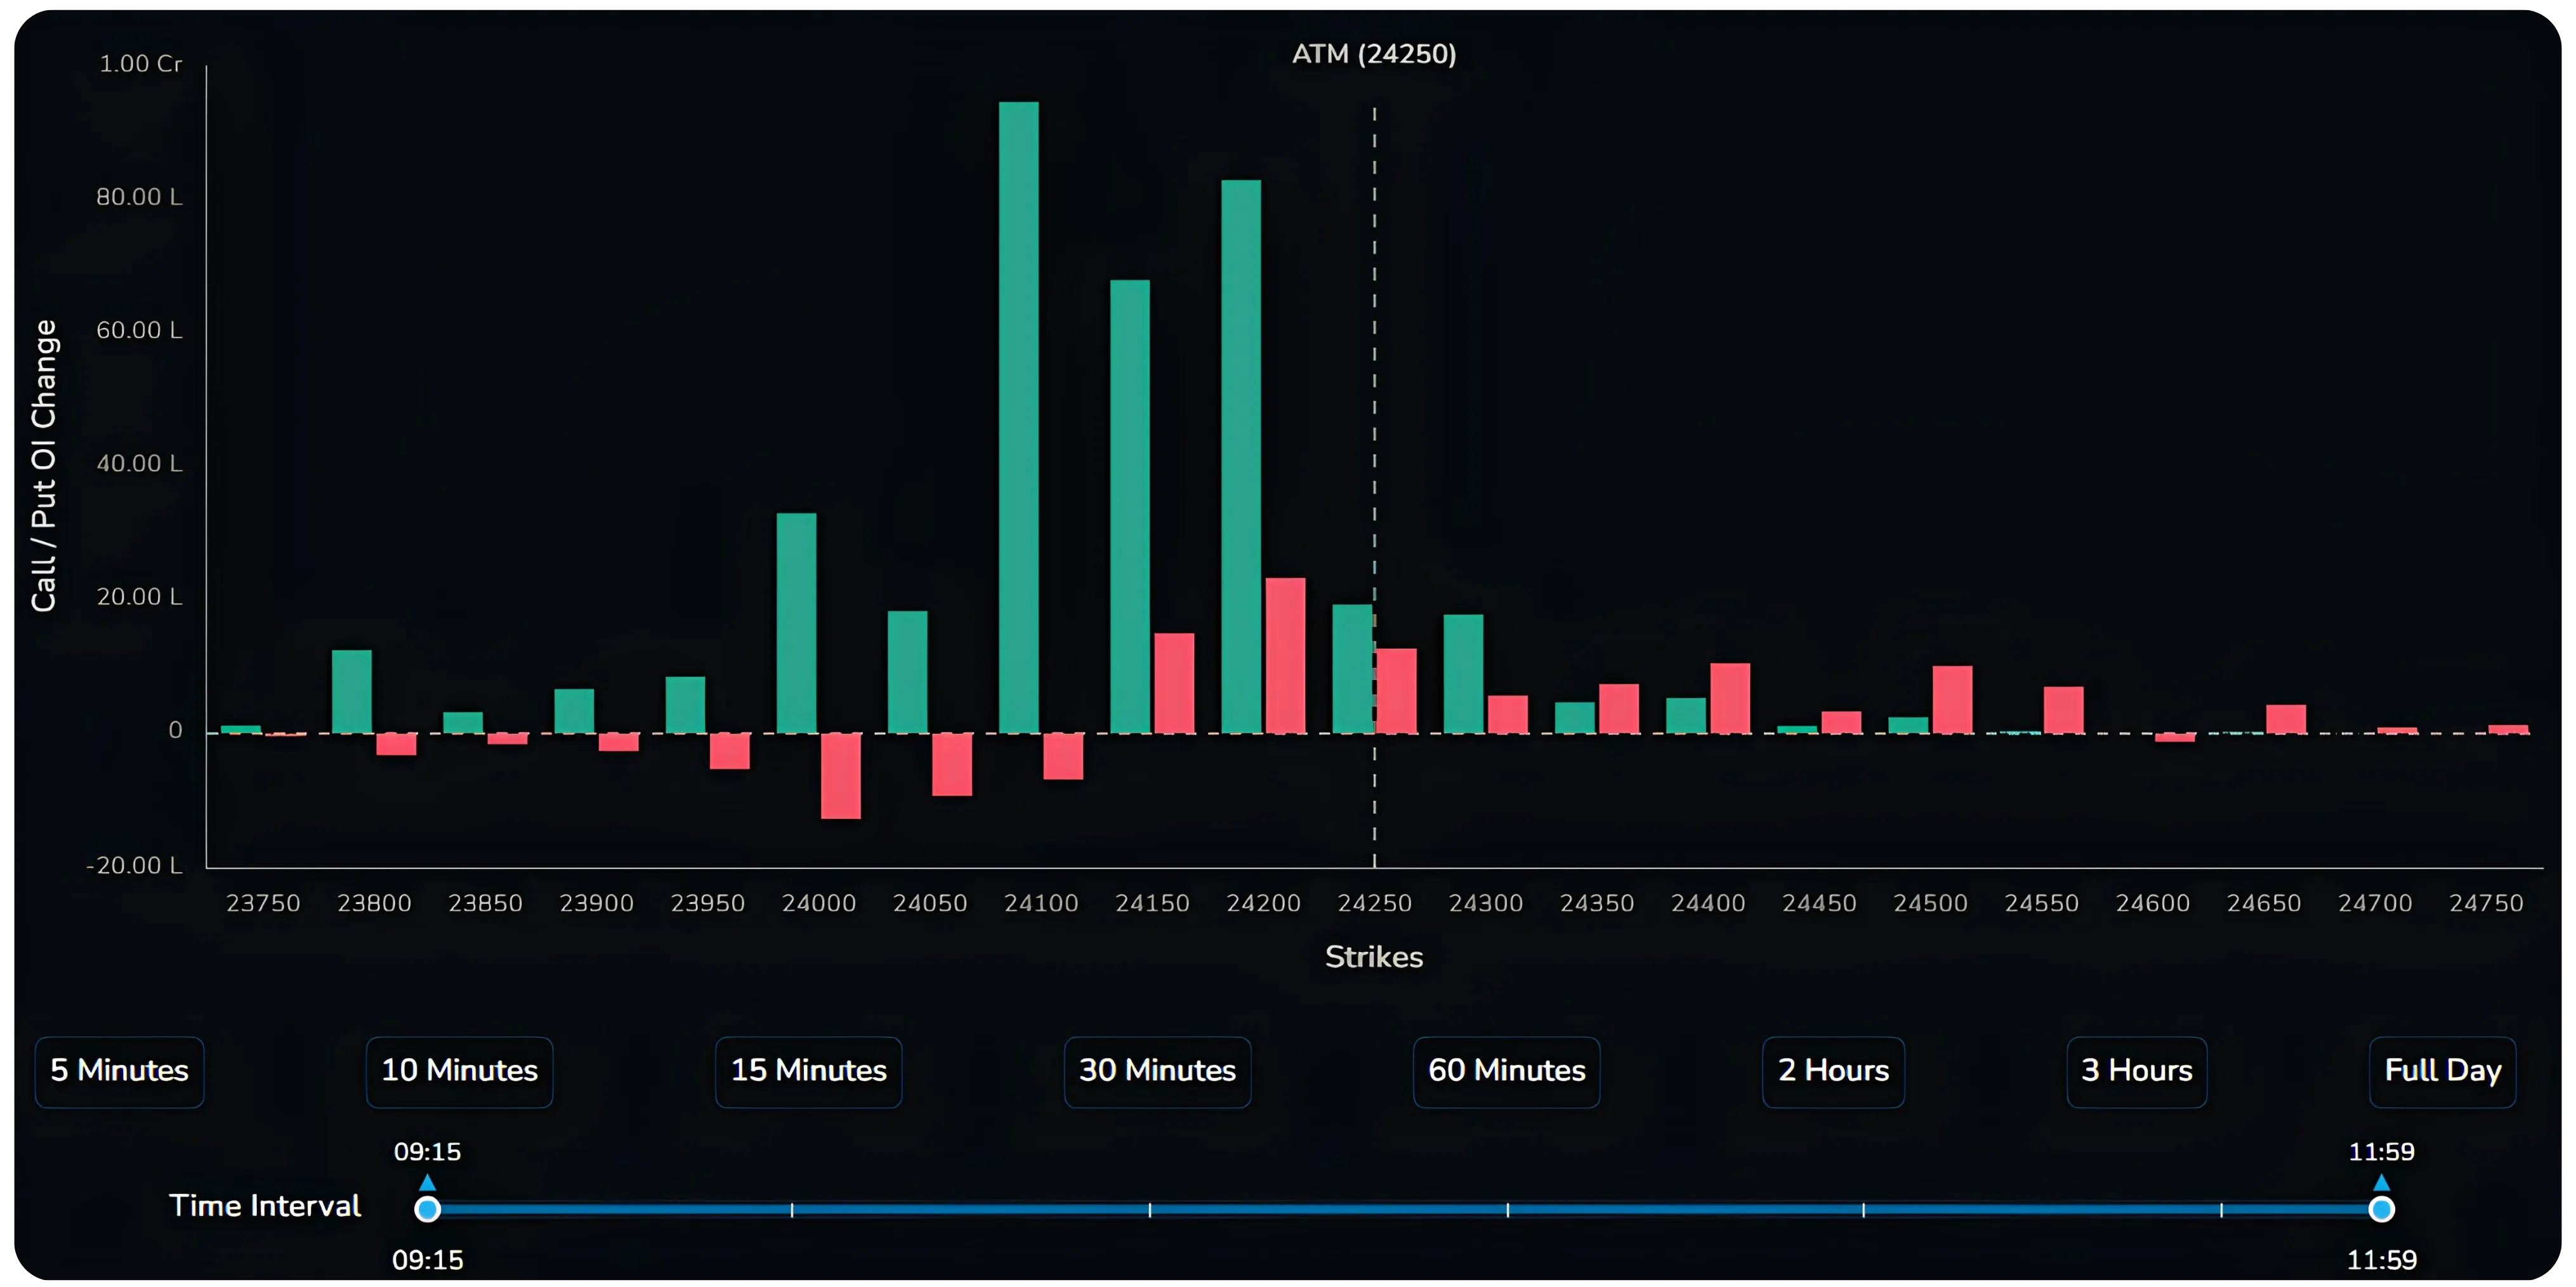
This is where NXTOption's OI Change feature becomes truly actionable for intraday traders. At the bottom of the chart, you will find a row of time bucket buttons:
| Time Bucket | What It Shows | Best Used By |
|---|---|---|
| 5 Minutes | OI change in the last 5 minutes only | Scalpers watching for sudden institutional moves |
| 10 Minutes | OI change in the last 10 minutes | Short-term momentum traders |
| 15 Minutes | OI change over the last 15 minutes | Intraday traders using 15-minute chart setups |
| 30 Minutes | OI change over the last 30 minutes | Swing traders and bracket order users |
| 60 Minutes | Cumulative OI change over the last hour | Positional intraday traders |
| 2 Hours | OI change over the last two hours | Mid-day trend followers |
| 3 Hours | OI change over the last three hours | Traders assessing morning bias into the afternoon session |
| Full Day | Total cumulative OI change since 9:15 AM | End-of-day analysis and overnight position planning |
Why does this matter? Options OI data is cumulative in nature. If you look at the Full Day view, it shows where OI has built up since the market opened; useful for context, but it hides the intraday story. A move that happened at 9:30 AM might have reversed completely by 11 AM.
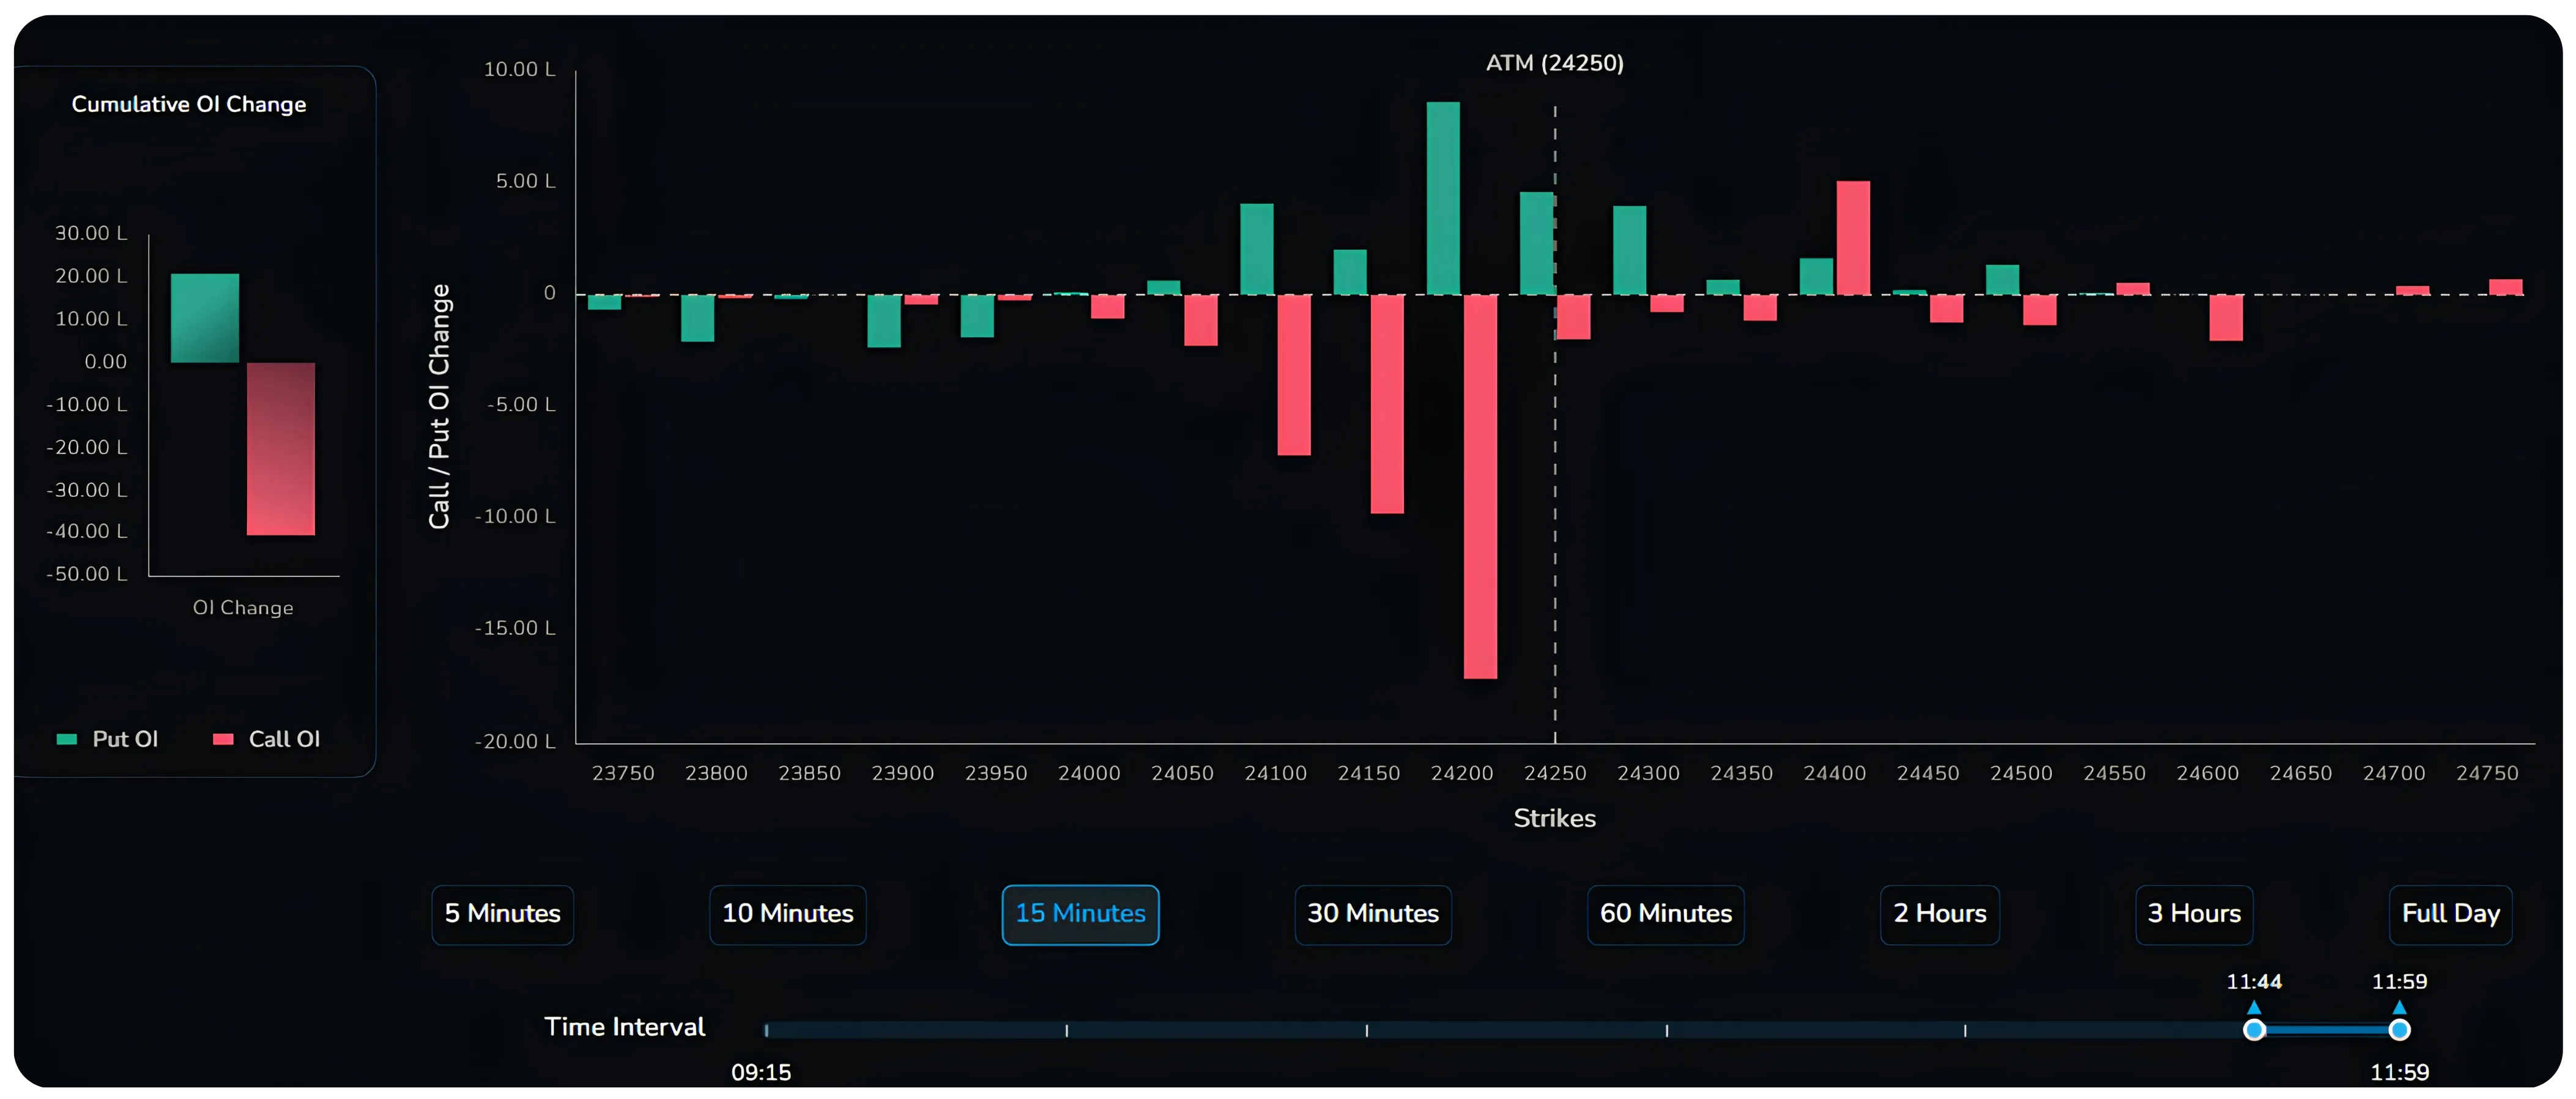
Switching to the 10-minute or 15-minute bucket shows you what is happening right now. If the 15-minute view suddenly shows a large red bar appearing at 24200 (the ATM), it means Call writers jumped in at that level in the last 15 minutes; a sign that the market may face resistance right here, right now.
The Time Interval Slider
Below the time bucket buttons, there is a Time Interval slider. This lets you scrub back through the trading day. You can drag the slider to 9:15 AM to see how OI looked at market open, or position it at any point during the session to study how OI evolved over time — essentially a replay of the day's OI story. This is especially useful for post-trade analysis and learning.
Also Read: How to Trade the Bull Call Spread Using NxtOption
The Expiry Filter: Separating Near-Term from Far-Term

Above the chart, you will see multiple expiry date tabs:
- 30 Jun 2026 (current weekly expiry — checked by default)
- 07 Jul 2026 (W1 — next week)
- 14 Jul 2026 (W2)
- 21 Jul 2026 (W3)
- 28 Jul 2026 (monthly expiry)
For intraday traders: You almost always want to focus on the current weekly expiry (the first tab). This is where the most active trading and highest OI concentration sits. Moves in weekly expiry OI drive intraday price action.
For positional traders and investors: Checking the monthly expiry OI gives a broader picture of where large institutions are building multi-week positions. A trader planning to hold for a few weeks can compare the monthly expiry OI to identify meaningful support and resistance levels for that horizon.
You can check multiple expiries simultaneously. When you tick more than one expiry, the chart aggregates OI across all selected expiries; useful for understanding total market-wide positioning at each strike, regardless of when those positions expire.
Strike Count and Strike Range: Zooming In and Out
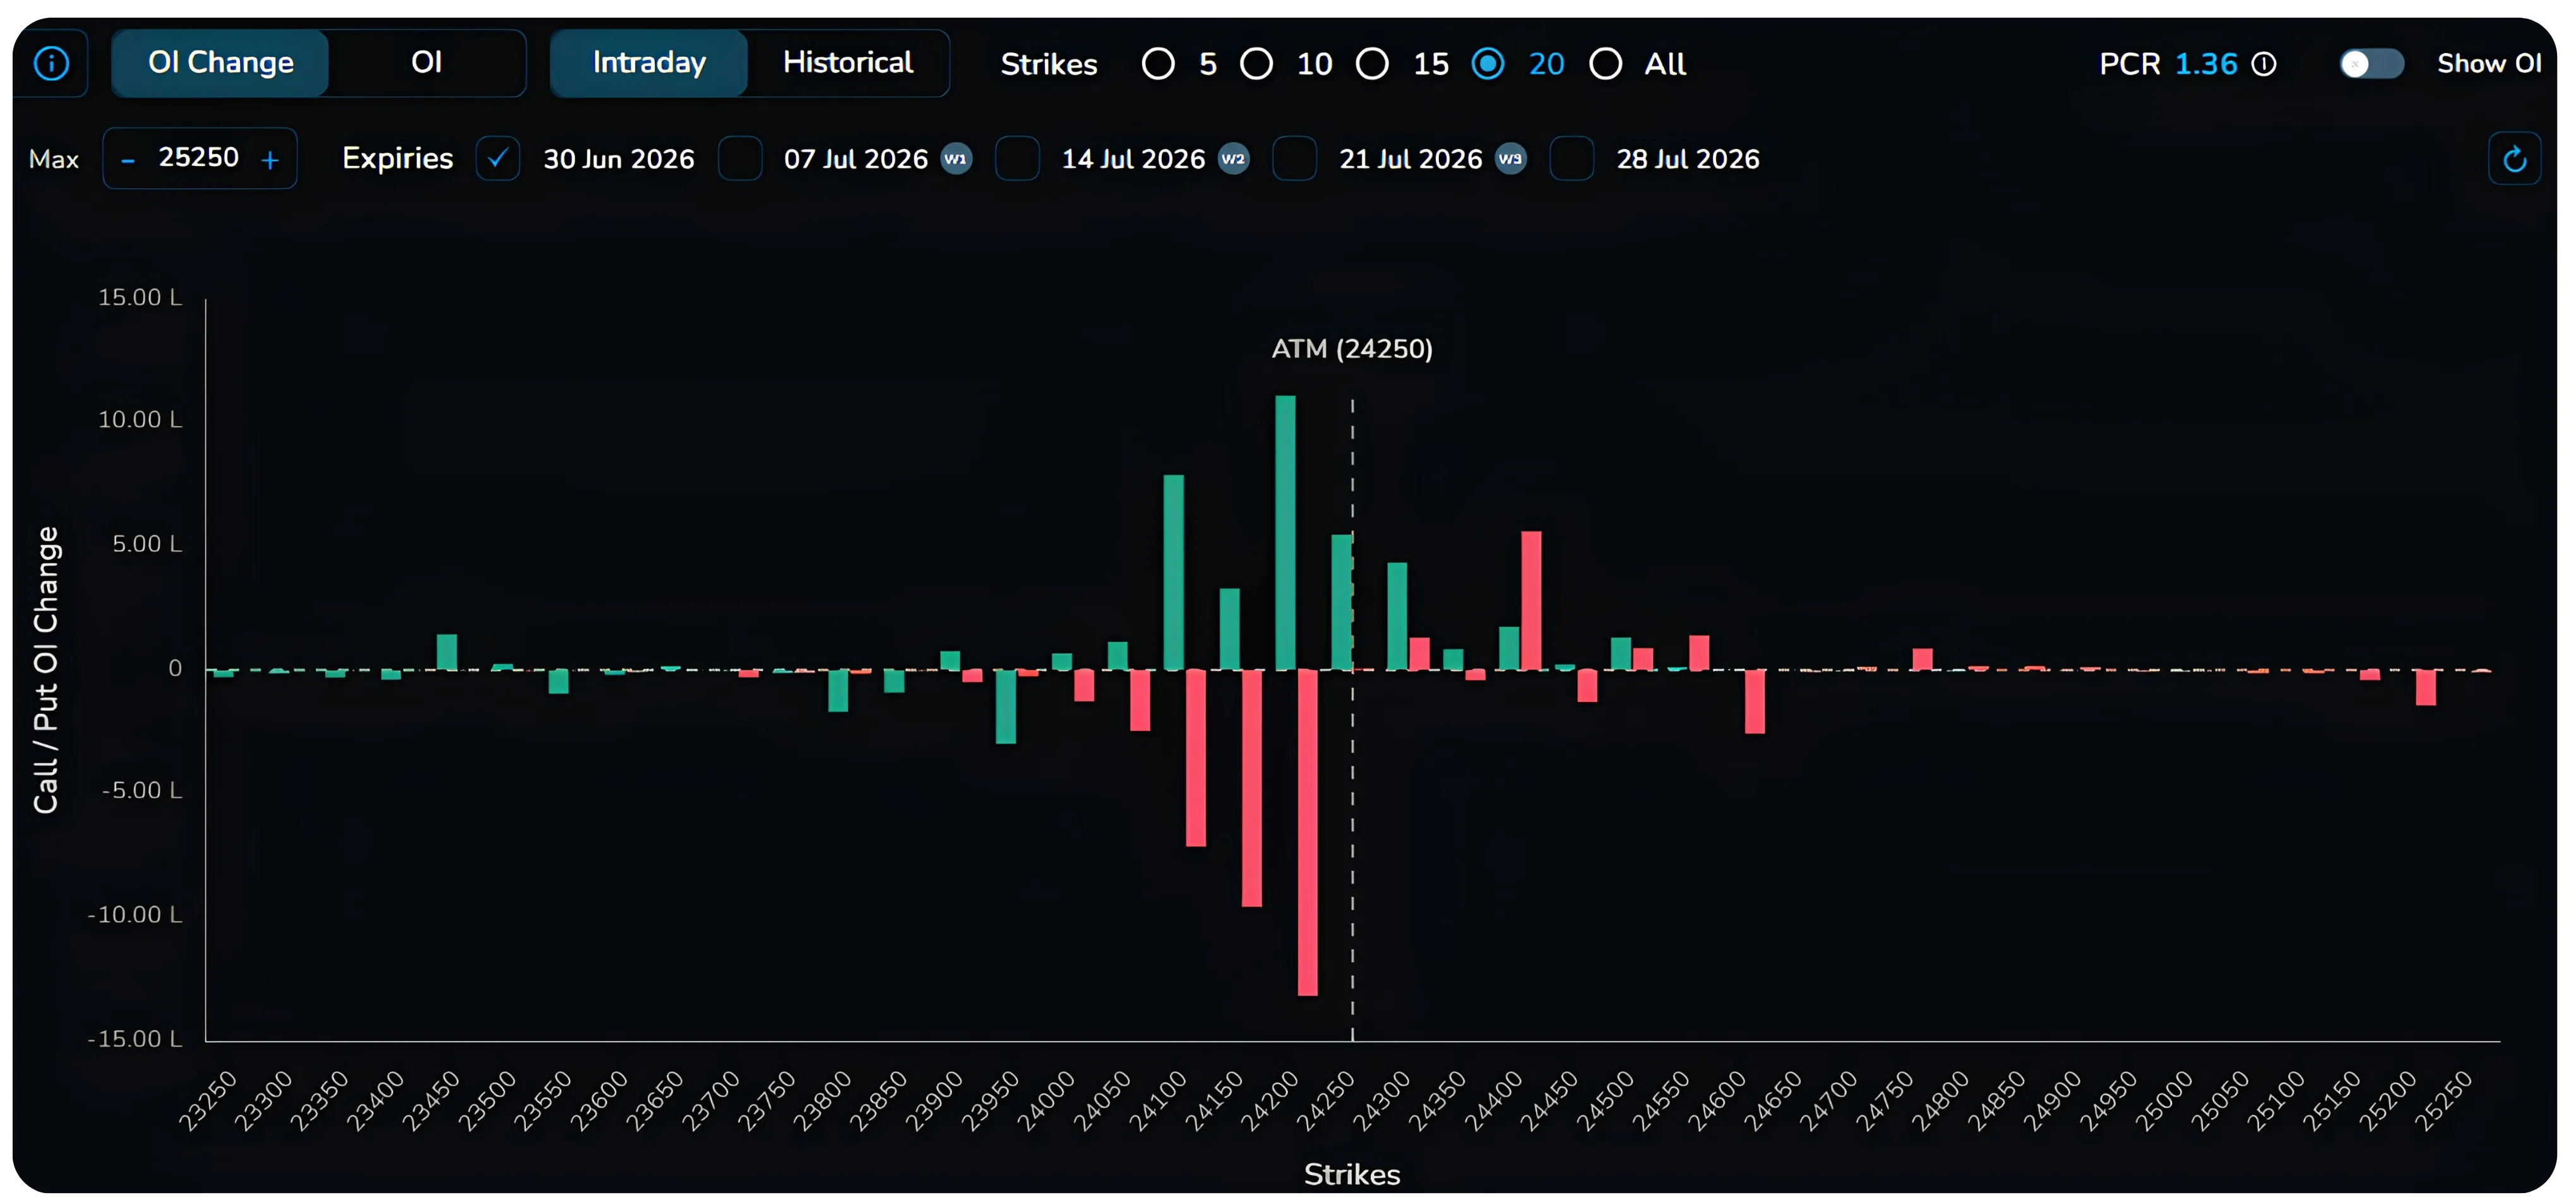
On the top right, the Strikes filter lets you toggle between 5, 10, 15, 20, or All strikes displayed. This changes how many strikes around ATM are shown on the chart.
Setting Strikes Shown When to Use
| Number of Strikes | Strike Range Displayed | Best Used For |
|---|---|---|
| 5 | 2 strikes on each side of ATM | Hyper-focused scalping around the current price |
| 10 (Default) | 5 strikes on each side of ATM | Standard intraday trading view |
| 15 | 7 strikes on each side of ATM | Broader context for identifying nearby support and resistance |
| 20 | 10 strikes on each side of ATM | Understanding the wider range the options market expects |
| All | Full strike range | Complete market-wide Open Interest (OI) picture |
The Strike Range filter (Min and Max) lets you set a custom range; useful when NIFTY has drifted significantly and you want to focus on strikes between, say, 23800 and 24400.
PCR: The Single Number That Summarises the Mood
PCR stands for Put-Call Ratio. It is calculated as:
PCR = Total Put OI ÷ Total Call OI
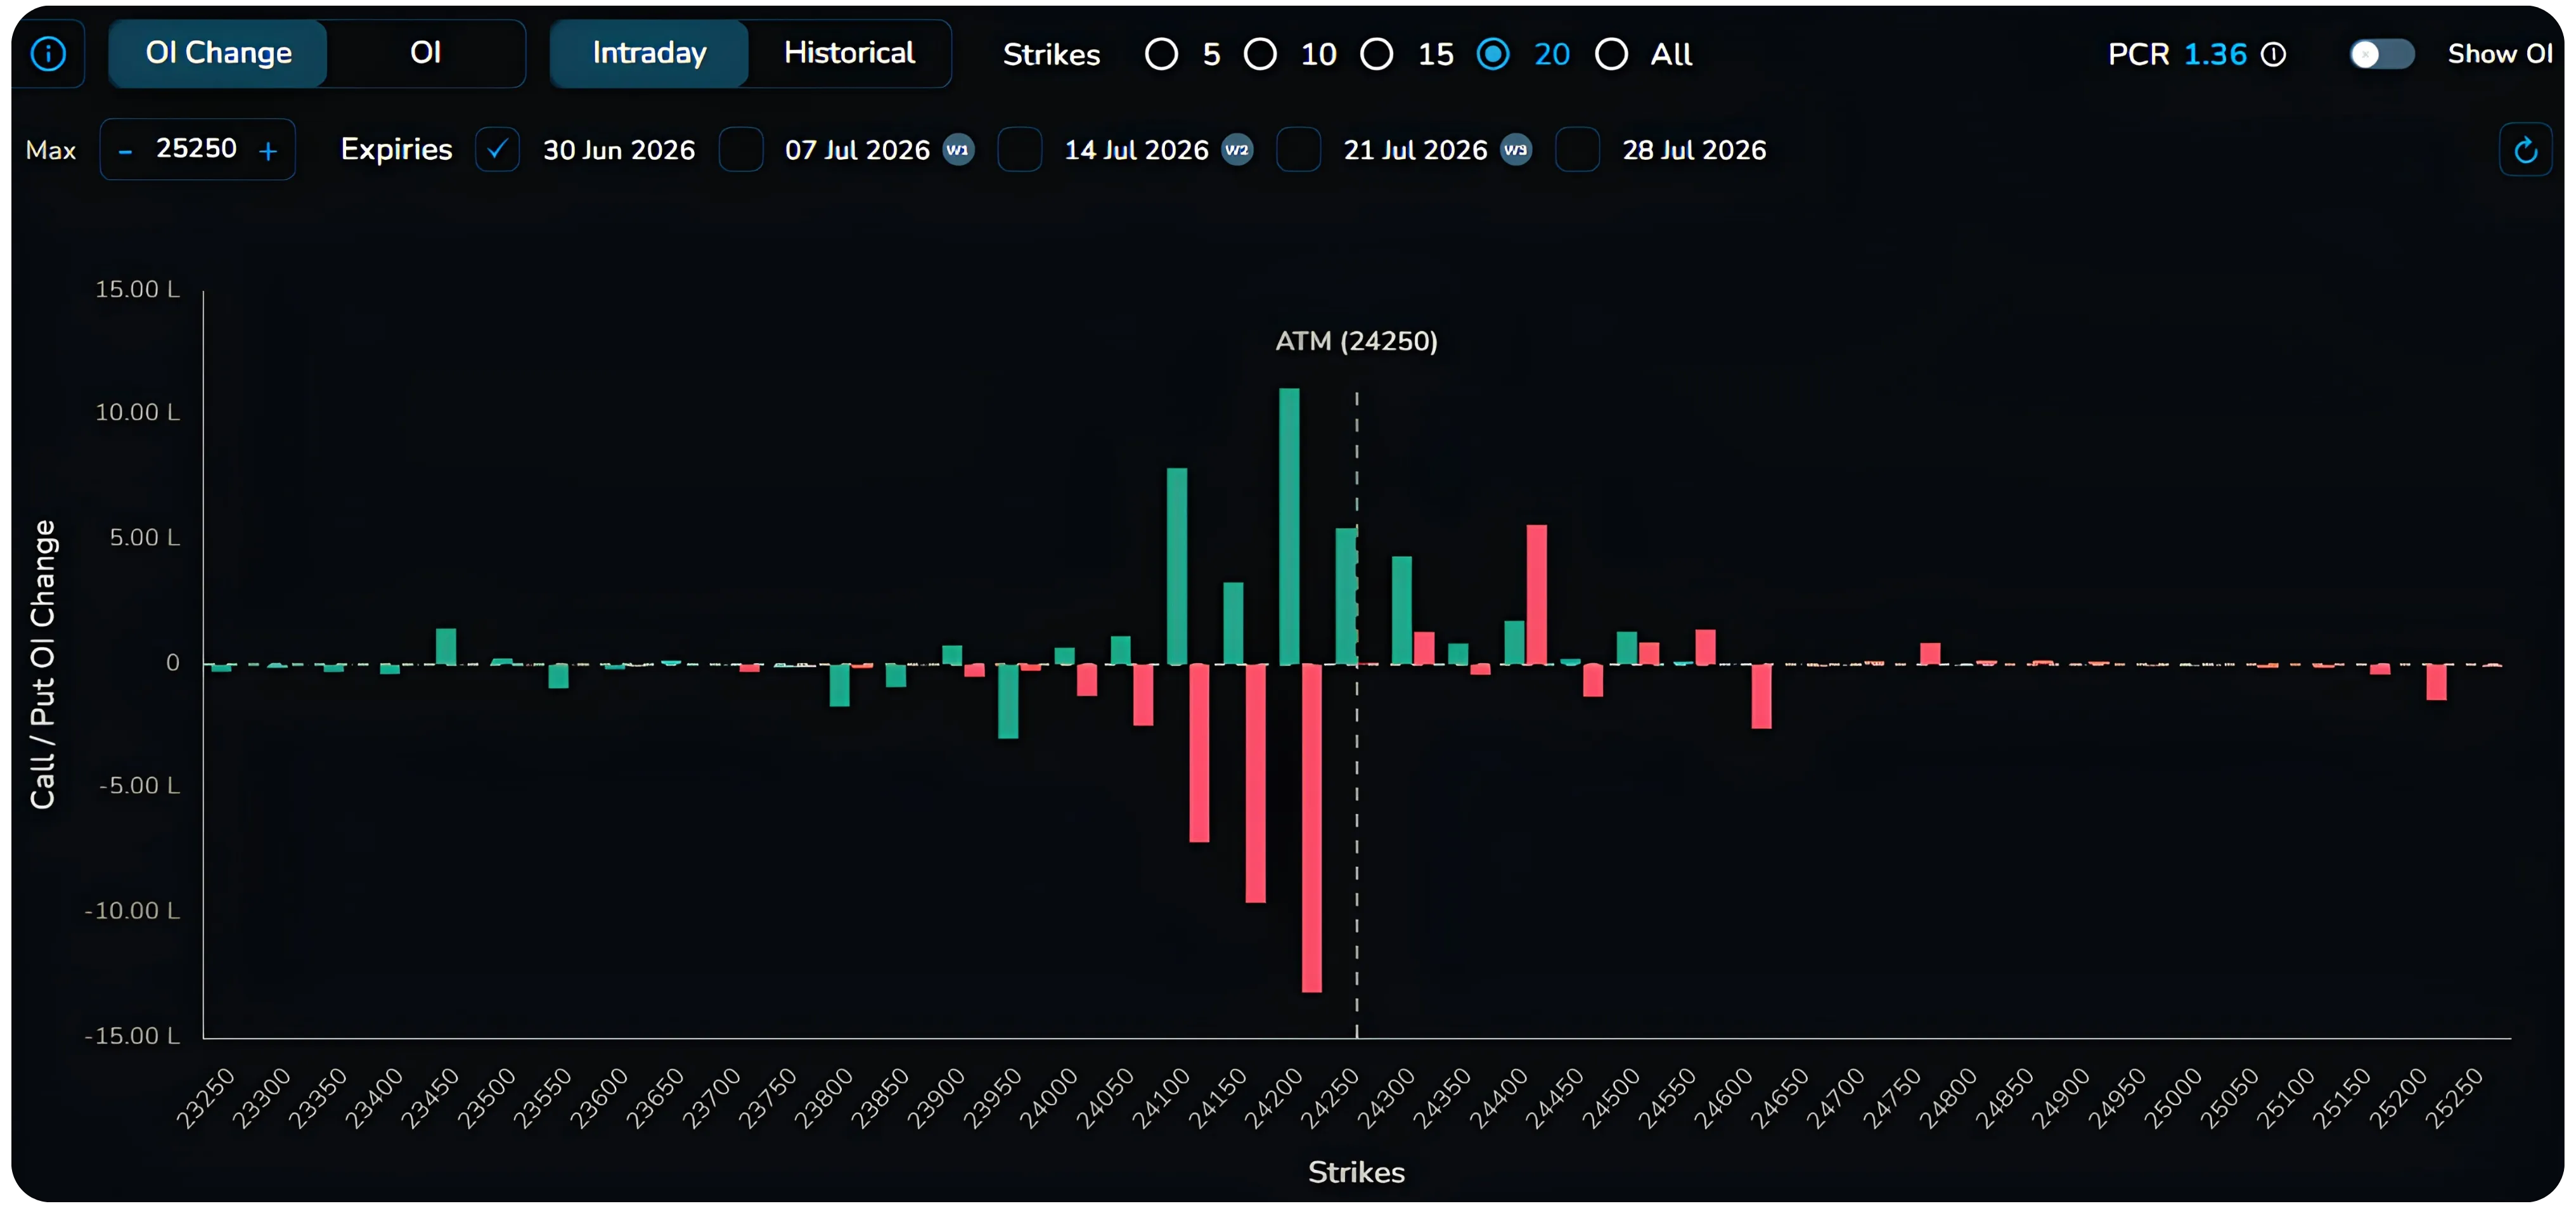
You can see PCR displayed in the top right corner of the OI Stats screen. In the image, it reads 1.36.
| PCR Value | What It Means | Market Implication |
|---|---|---|
| Below 0.7 | Significantly more Call writing than Put writing | Strongly bearish sentiment. Traders expect the market to decline. |
| 0.7 – 1.0 | Moderate Call dominance | Slightly bearish outlook with cautious market expectations. |
| 1.0 – 1.2 | Balanced positioning with a slight Put bias | Neutral to mildly bullish sentiment. |
| 1.2 – 1.5 | Clear Put dominance | Bullish sentiment. Put writers are confident the market is likely to stay above key support levels. |
| Above 1.5 | Heavy Put writing, which can become an overcrowded trade | Strongly bullish sentiment, but also a potential contrarian signal. Watch for reversal if Put writing becomes excessive. |
A PCR of 1.36 tells us that for every 100 Call contracts added to OI, around 136 Put contracts were added. Put writers outnumber Call writers, which typically signals that the market has more sellers of downside protection than sellers of upside protection; a bullish setup.
Important Nuance: PCR is a contrarian indicator at extremes. An extremely high PCR (above 1.5) can sometimes mean the market is overly optimistic and ripe for a correction.
Context always matters: look at PCR alongside the OI Change chart, not in isolation.
You can also click on PCR Chart in the left sidebar to see how PCR has moved over time during the day. A falling PCR intraday may signal that Call writing is picking up (bearish pressure building).
The Cumulative OI Change Panel: The Quick Scoreboard
On the left side of the screen, the small bar chart titled Cumulative OI Change gives you an instant summary: total Put OI added vs total Call OI added for the selected time period and expiry.
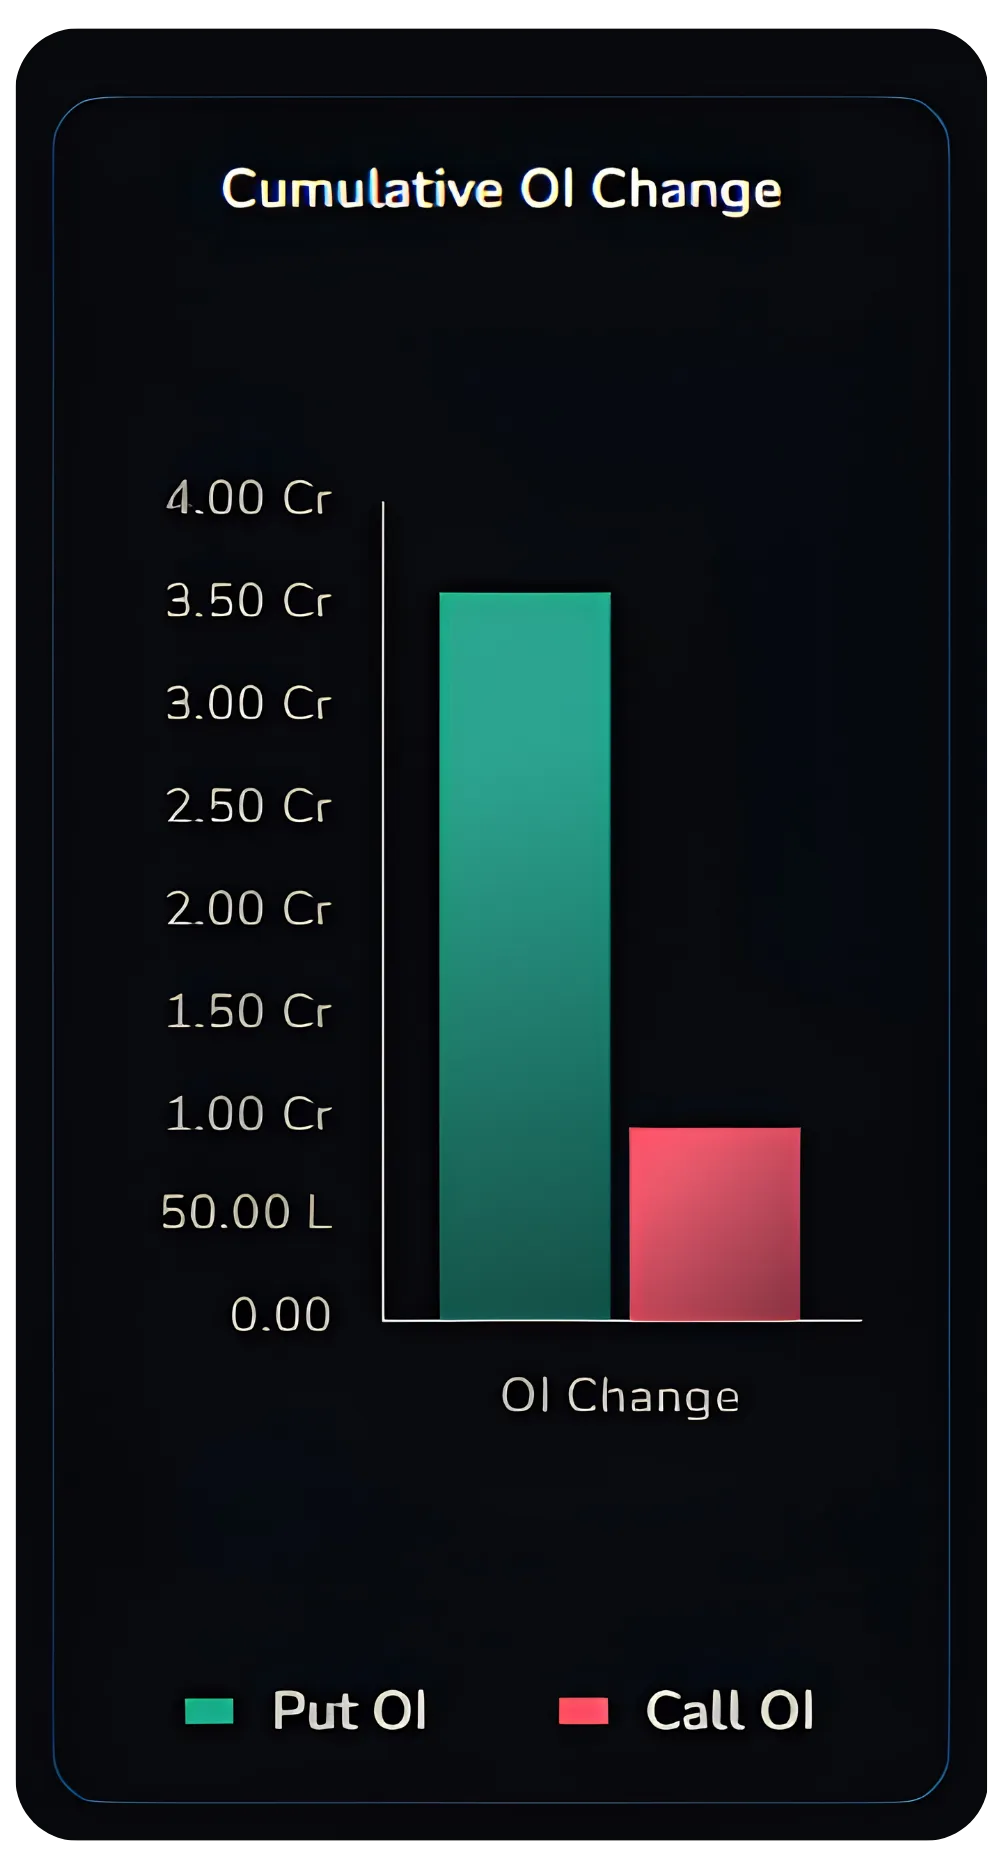
In the image, you can see the green (Put) cumulative bar is clearly taller than the pink (Call) bar, roughly 3.5 Cr vs 1 Cr. This means that across all strikes, far more Put OI was added than Call OI during the day. That single image confirms a net bullish sentiment from options writers.
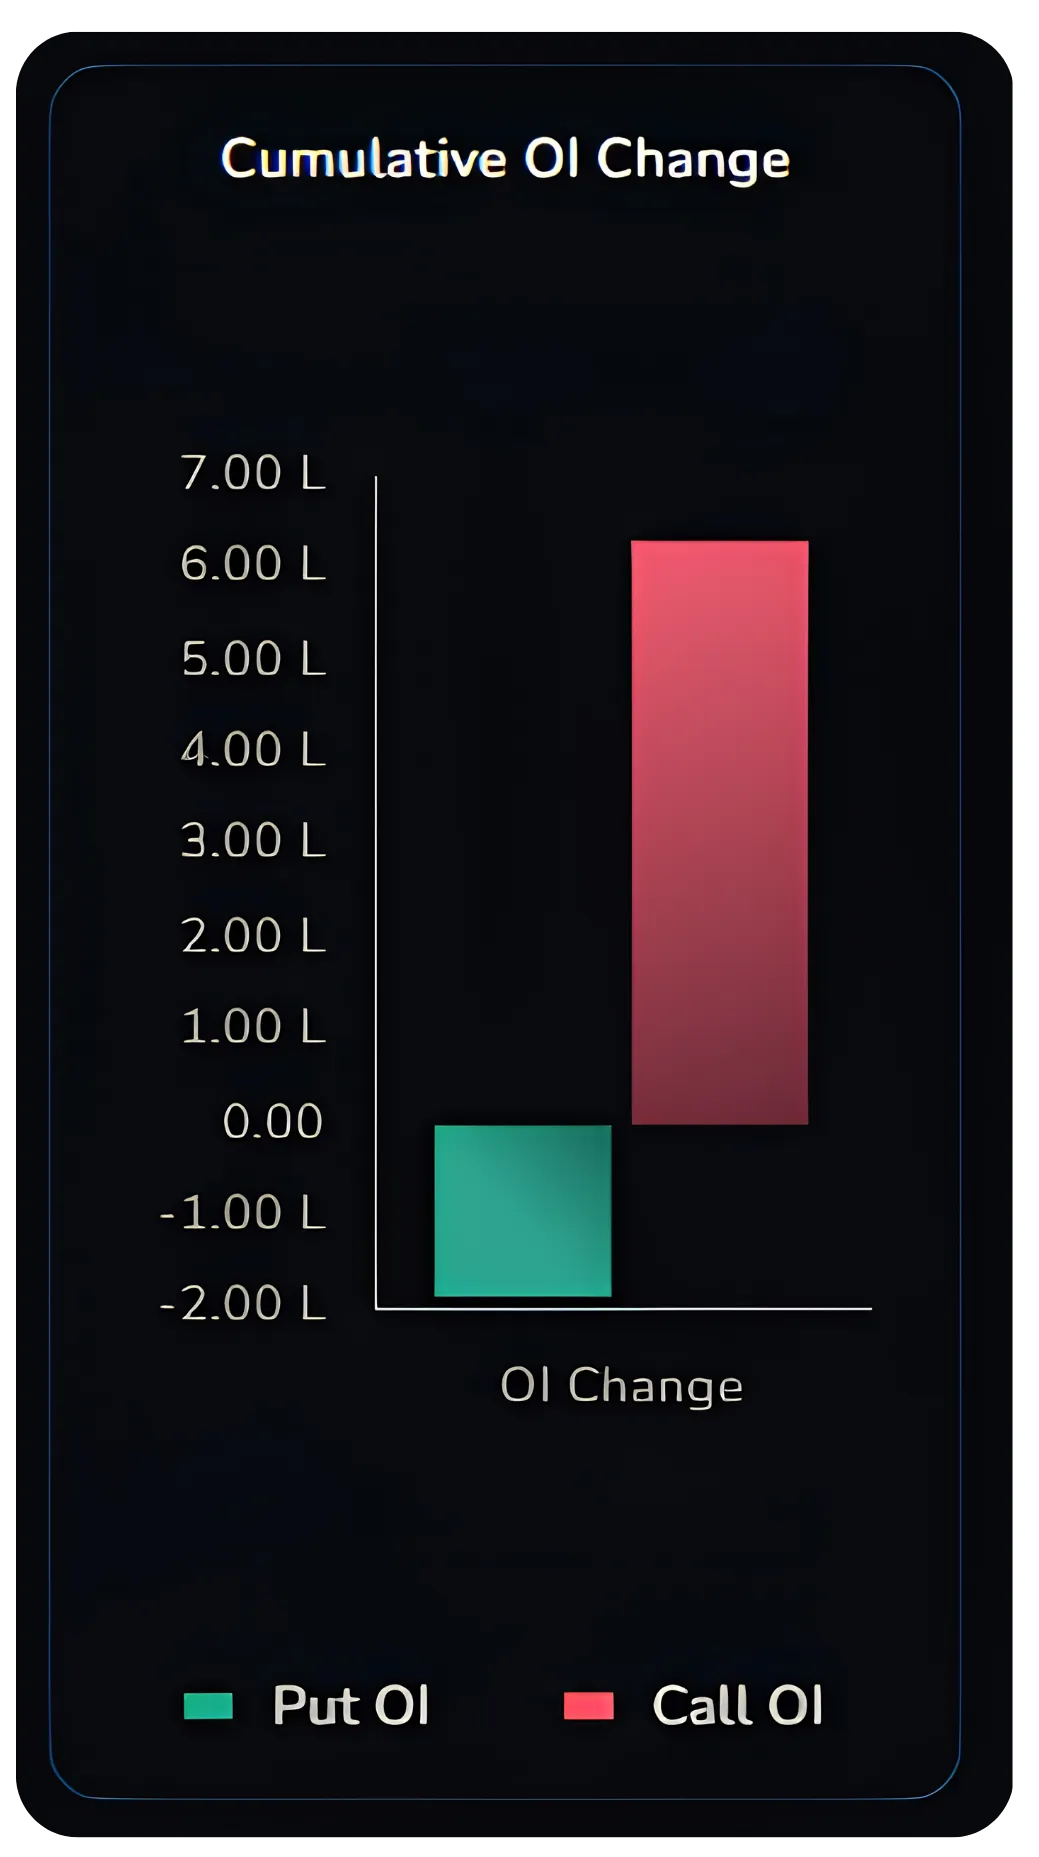
When you switch to the 10-minute bucket, the cumulative panel refreshes to show only the most recent 10 minutes of activity. Here, the Put OI bar is negative while the Call OI bar is strongly positive. This indicates that Put writers were unwinding (closing) positions, whereas Call writers were actively adding fresh positions. Together, this reflects a bearish shift in sentiment over the last 10 minutes, with traders reducing bullish Put exposure and simultaneously building bearish Call positions.
How to Use OI Change to Make Trading Decisions
Here is a practical framework that traders apply using the OI Change screen:
Step 1: Identify the Range (Full Day View)
Start with the Full Day OI Change view at the beginning of your trading session. Find the strikes with the largest green bars (Put writing = support) and the largest red bars (Call writing = resistance). These define your trading range for the day.
Step 2: Set Your Levels
Note the strikes where dominant Put OI sits (strong support) and where dominant Call OI sits (strong resistance). In our example, 24000 is the Put writing stronghold (support) and 24500 is the Call writing stronghold (resistance). This gives a likely range of 24000 to 24500.
Step 3: Watch Time Buckets for Entry Signals
Switch to the 15-minute or 10-minute bucket while trading. Watch for new large bars appearing at the ATM strike. If a big green bar forms at ATM: support is being written right below the current price: potential buy signal. If a big red bar forms at ATM: resistance is being written right at the current price: caution, possible rejection point.
Step 4: Use PCR as Confirmation
Check the PCR to confirm the overall sentiment. A rising PCR alongside green bar dominance = strong bullish signal. A falling PCR with red bars growing = shift toward bearish sentiment.
Step 5: Re-Check as the Day Progresses
OI can shift dramatically. A support level that held in the morning can be abandoned by afternoon if large players exit. Checking the 30-minute or 60-minute bucket every hour helps you stay aligned with where smart money is active.
| Scenario | OI Change Signal | Trader Action |
|---|---|---|
| Market near 24000, large Put build | Strong green bar at 24000 in the 15 minute bucket | Buy on dips toward 24000; stop below 23950 |
| Market near 24200, large Call appears | Big red bar forming at ATM in the 10 minute bucket | Exit longs or take a short entry; target 24100 |
| PCR rising from 1.0 to 1.3 intraday | Puts being added across strikes | Hold bullish positions; don't short |
| Both bars shrinking in the 10 minute bucket | Unwinding, no fresh positions | Avoid fresh entries; wait for fresh build |
| Large Call bar at 24500 all day | Resistance wall holding | Consider a Bear Call Spread from 24500 upward |
Also Read: Trading the Bull Put Spread on HUL using NxtOption
Show OI vs OI Change: When to Use Which
The toggle on the top right switches between OI Change (default) and OI (absolute levels).
| View | What It Shows | Best For |
|---|---|---|
| OI Change | How much OI was added or removed during the selected time period | Intraday trading decisions and spotting fresh buildup or unwinding |
| OI (Show OI toggle ON) | Total accumulated OI at each strike across all time | Identifying long term support and resistance, and calculating Max Pain |
A useful combination: use OI to see where the big positions have historically accumulated (the mountain ranges), then switch to OI Change in a short time bucket to see where fresh action is happening right now (the earthquakes in those mountains).
Intraday vs Historical Mode
At the top of the chart, there are two mode buttons: Intraday and Historical.
Intraday mode (the default) shows today's live data; what's happening right now. The time bucket and slider work in real time.
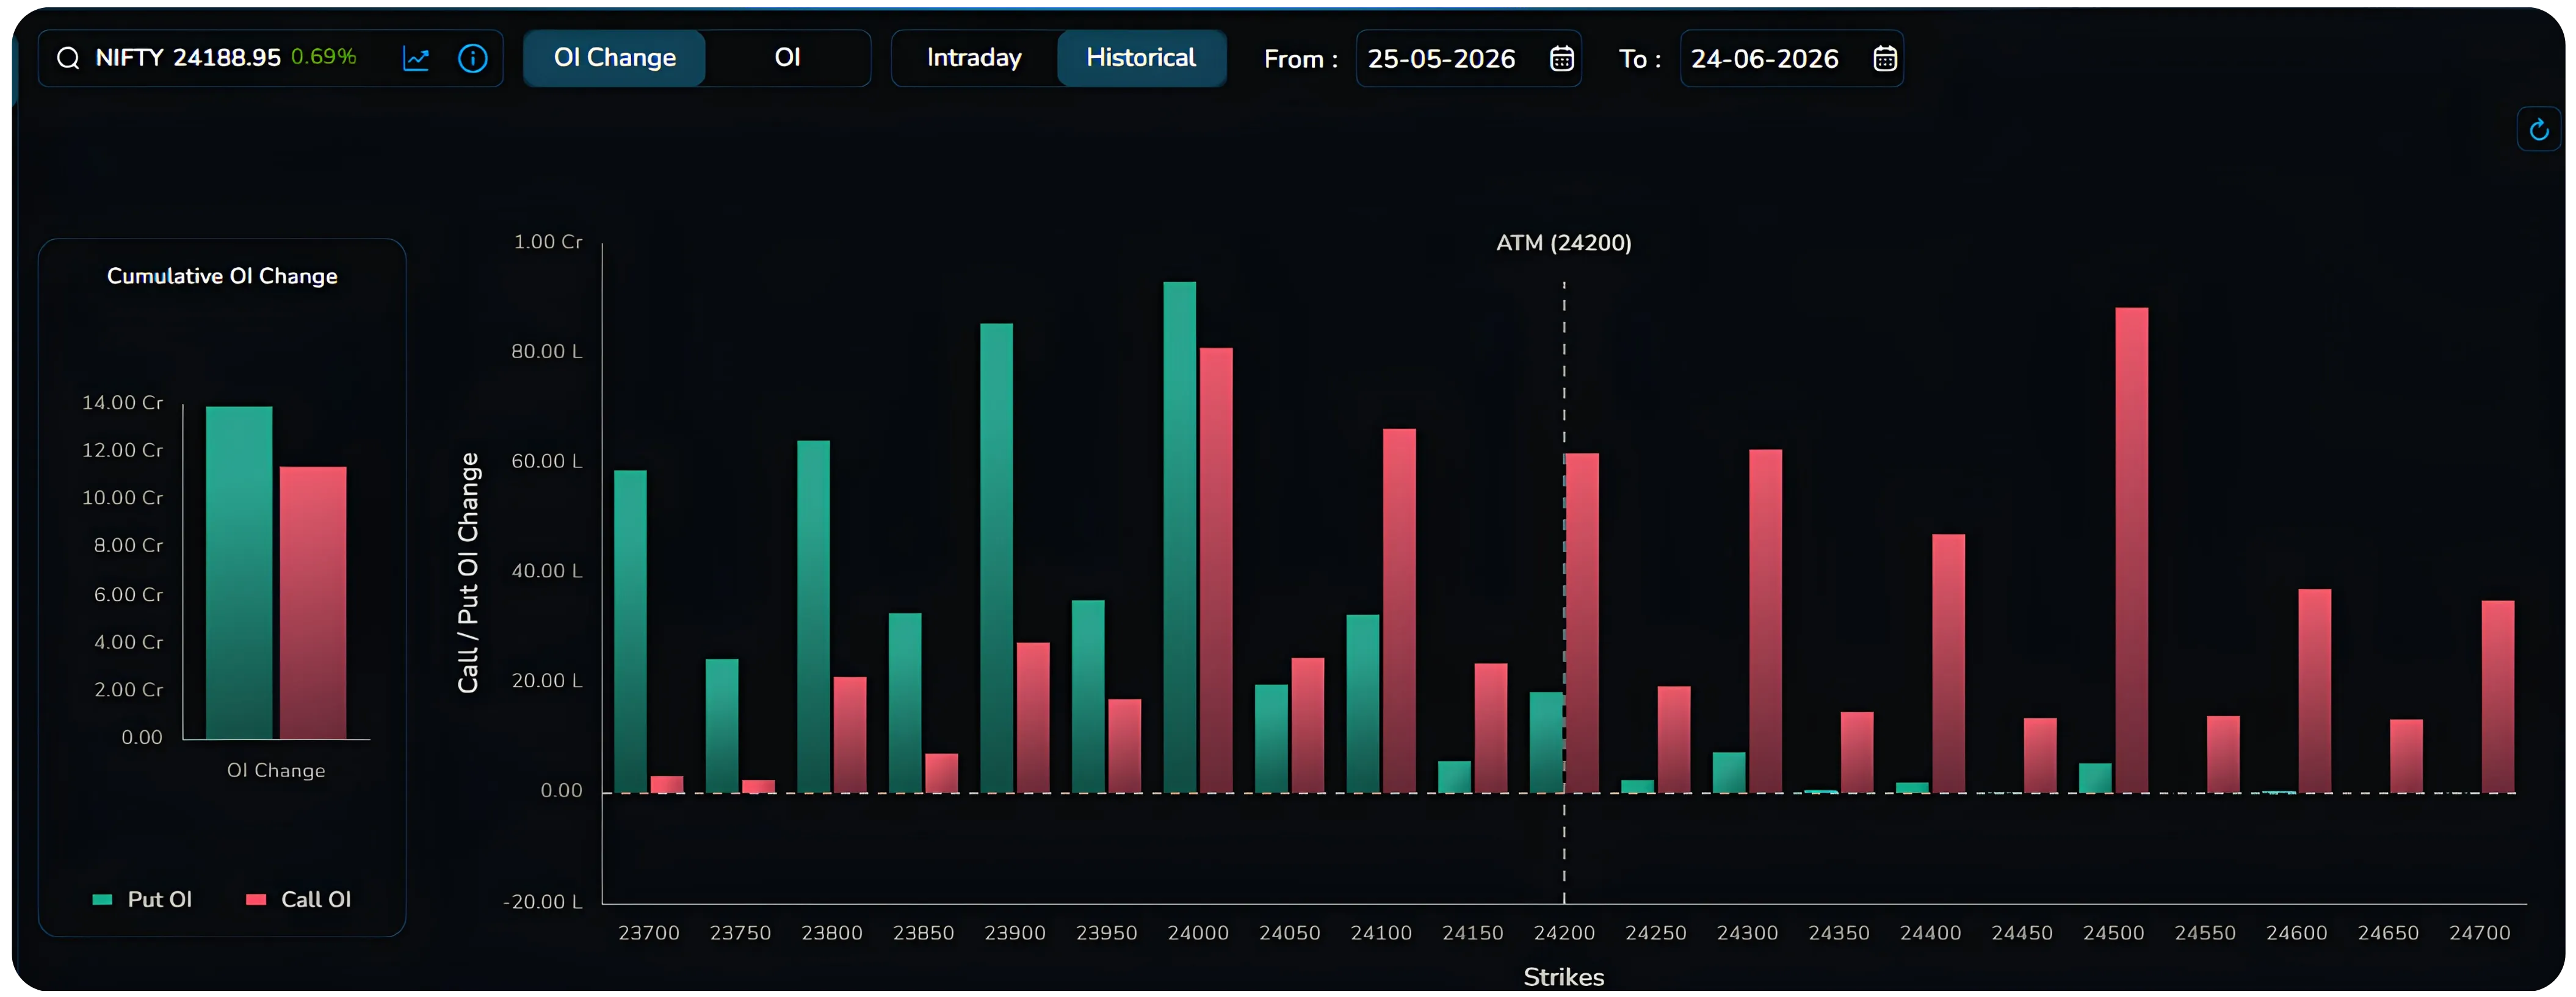
Historical mode lets you go back to any past trading day and replay the OI change story for that session. This is invaluable for learning. You can study how OI developed on a day when NIFTY made a sharp move, and understand what the options market was signalling before that move happened.
Putting It All Together
The OI Change feature on NXTOption is not just a data display — it is a live feed of market intent. Here is a one-line summary of everything covered:
- Green bars = Put writing = support building at that strike
- Red bars = Call writing = resistance building at that strike
- Time buckets = controls how fresh the data is (shorter = more current)
- Expiry filter = choose weekly for intraday, monthly for positional
- PCR above 1.0 = more Puts being written = bullish tilt in the market
- Cumulative panel = instant overall summary of the day's OI mood
- Show OI toggle = switch between change (dynamic) and total (static) views
- Historical mode = study and learn from past sessions
Used together, these features give you what most retail traders never have access to: a clear view of where institutional and professional traders are placing large bets, in real time, at the exact strike levels that matter.
You don't need to guess where support or resistance lies. The OI Change screen shows you, updated minute by minute. All you need to do is read the bars.
Disclaimer: The information provided in our blogs is for informational purposes only and should not be construed as financial, investment, or trading advice. Trading and investing in the securities market carries risk. Always conduct your own research and consult with a qualified financial advisor before making any investment decisions. Past performance is not indicative of future results. Copyrighted and original content for your trading and investing needs.
© 2026 — Tradejini. All Rights Reserved.