


If you invest in mutual funds, you must have seen the term mutual funds XIRR on your portfolio statement or investment app. It is everywhere, but most investors are unsure what it really means and whether the number they see is good or bad. So what exactly is XIRR and how much good XIRR should you actually expect from your mutual fund investment?
This guide is for mutual fund investors who want to understand what XIRR means, how to interpret it, and what counts as a good XIRR for their investments. Knowing this helps you evaluate your portfolio's performance and make better investment decisions.
What is XIRR in Mutual Funds?
XIRR, or Extended Internal Rate of Return, is a financial metric used to determine the annualised return of an investment that has multiple cash flows occurring at irregular intervals. XIRR in mutual funds is calculated using actual cash flows, including all purchases, redemptions, and dividends, and it is essential to use the real transaction amounts and dates for accuracy.
XIRR stands for Extended Internal Rate of Return. In simple words, it shows the true annual return you earn from your investment portfolio after considering your systematic investment plans, top ups, withdrawals, different transaction dates, and market fluctuations. XIRR accounts for the timing and amount of each cash inflow and outflow, where positive values represent cash inflows such as redemptions and dividends. This method combines all cash flows and their respective timings into a single, annualised return figure, giving a true picture of mutual fund performance.
XIRR is particularly useful for measuring investment performance in scenarios with irregular cash flows, such as monthly SIPs, where the same amount is invested at regular intervals. This involves multiple cash flows, irregular cash flows, multiple investments, and multiple transactions happening during your investment journey.
Also read: How to Start SIP: A Guide on Mutual Funds Online & How Mutual Fund Payments Work
How to calculate XIRR for Mutual Fund Investments
Calculating XIRR for your mutual fund investment is an essential part of measuring your actual investment performance, especially when you have multiple cash flows occurring at different times. Since most investors make systematic investments, top-ups, or occasional withdrawals, the extended internal rate of return (XIRR) is the most accurate financial metric to evaluate your mutual fund returns.
Here’s a simple step-by-step process to calculate XIRR for mutual fund investments with irregular cash flows:
Gather All Transaction Data- Start by collecting a complete record of your mutual fund investment transactions. This includes every investment (such as SIPs, lump sum investments), withdrawal, and dividend payout, along with their respective transaction dates. Having both the amount and the date for each cash flow is crucial.
Identify Cash Flows- For calculation purposes, treat all investments (money you put in) as negative cash flows, since they are outflows from your account. Withdrawals, dividends, or any money you receive back are positive cash flows. Make sure to include the current value of your investment as the final positive cash flow on the date you are calculating XIRR.
Use the XIRR Formula or Excel Function- The XIRR formula is designed to find the internal rate of return that sets the net present value (NPV) of all cash flows to zero, even when the cash flows are irregular. While the mathematical formula is complex, you can easily calculate XIRR using spreadsheet software like Microsoft Excel or Google Sheets.
In Excel, use the XIRR function: =XIRR(values, dates, [guess])
“values” are the cash flow amounts (negative for investments, positive for withdrawals and current value).
“dates” are the corresponding transaction dates.
“[guess]” is optional and can usually be left blank.
Interpret the XIRR Result- The result you get is the annualized return (compounded annually) for your mutual fund investment, accurately reflecting all the multiple cash flows and their timing. A higher XIRR means your investment portfolio has performed better, considering the real-world pattern of your investments and withdrawals.
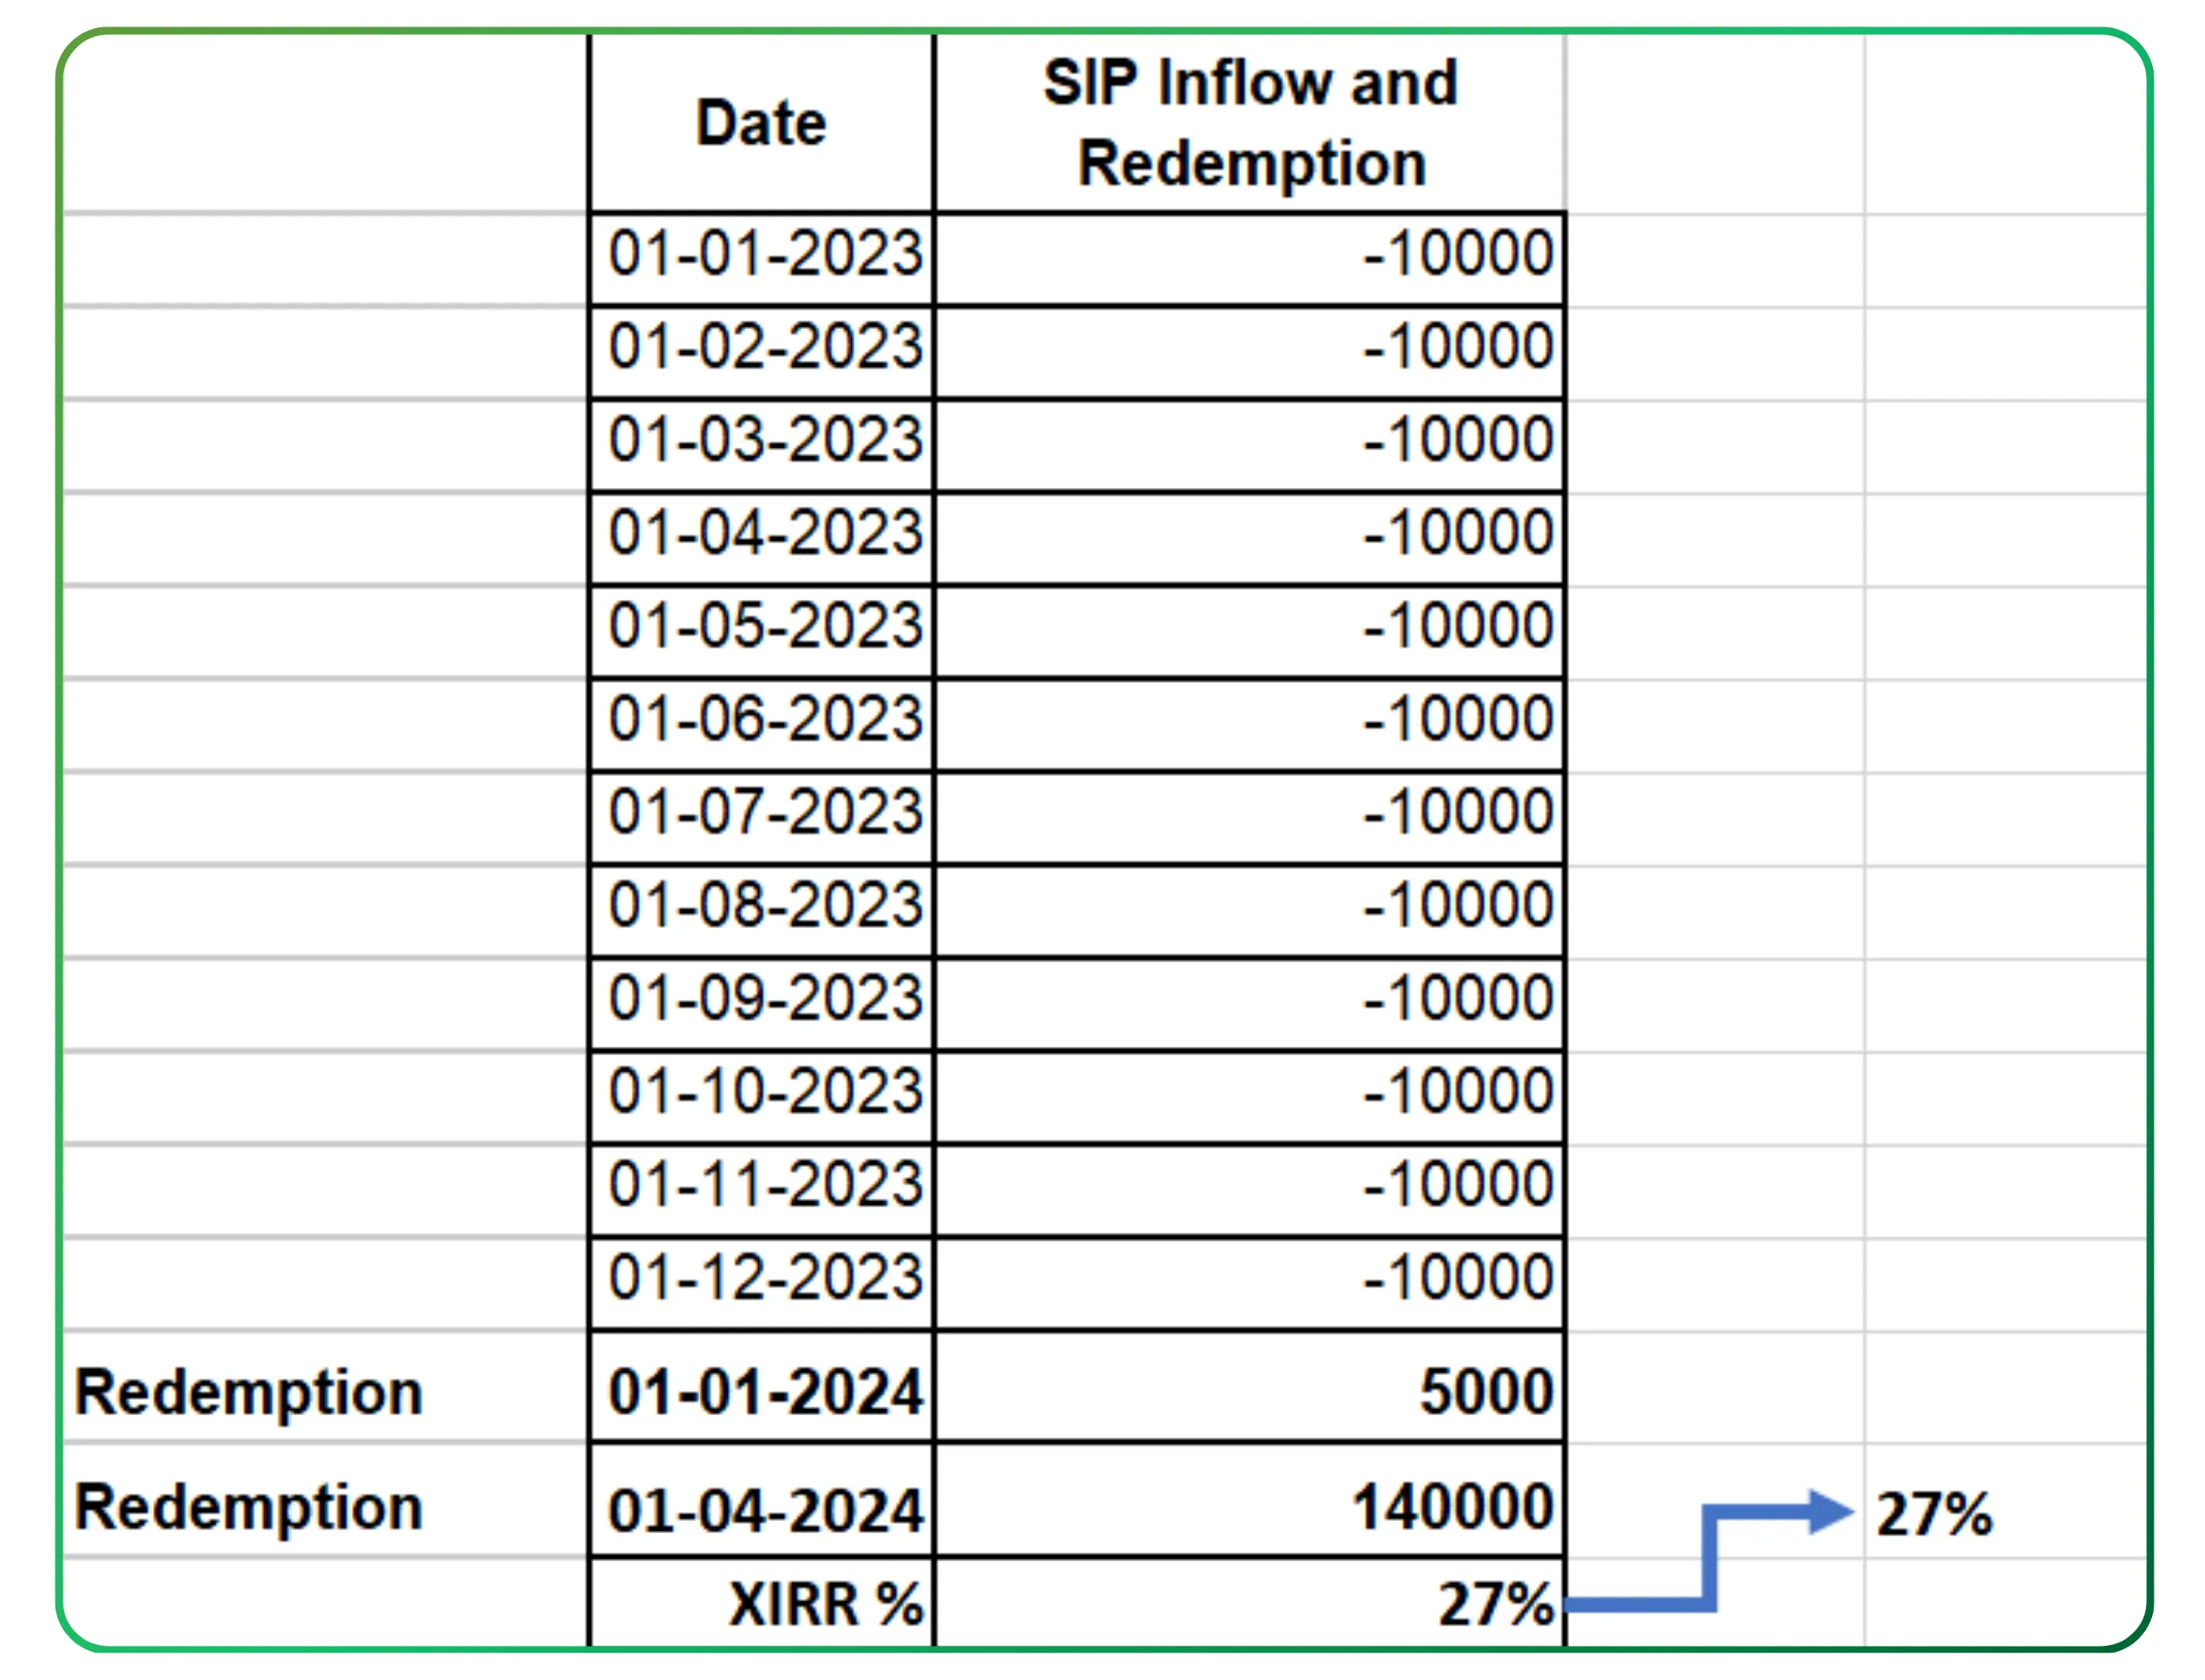
So when you look at XIRR calculated, you are actually seeing how your investments have performed in reality. Below image reflects the SIP inflows and for 12 months and 2 redemptions and then the XIRR is calculated.
By following these steps, you can calculate XIRR and gain a true picture of your mutual fund’s performance, helping you make informed investment decisions and compare different mutual fund schemes effectively.
Below image shows XIRR on Equity mutual fund in 2025
This image below is provided only for reference to help you understand and get an idea of XIRR.
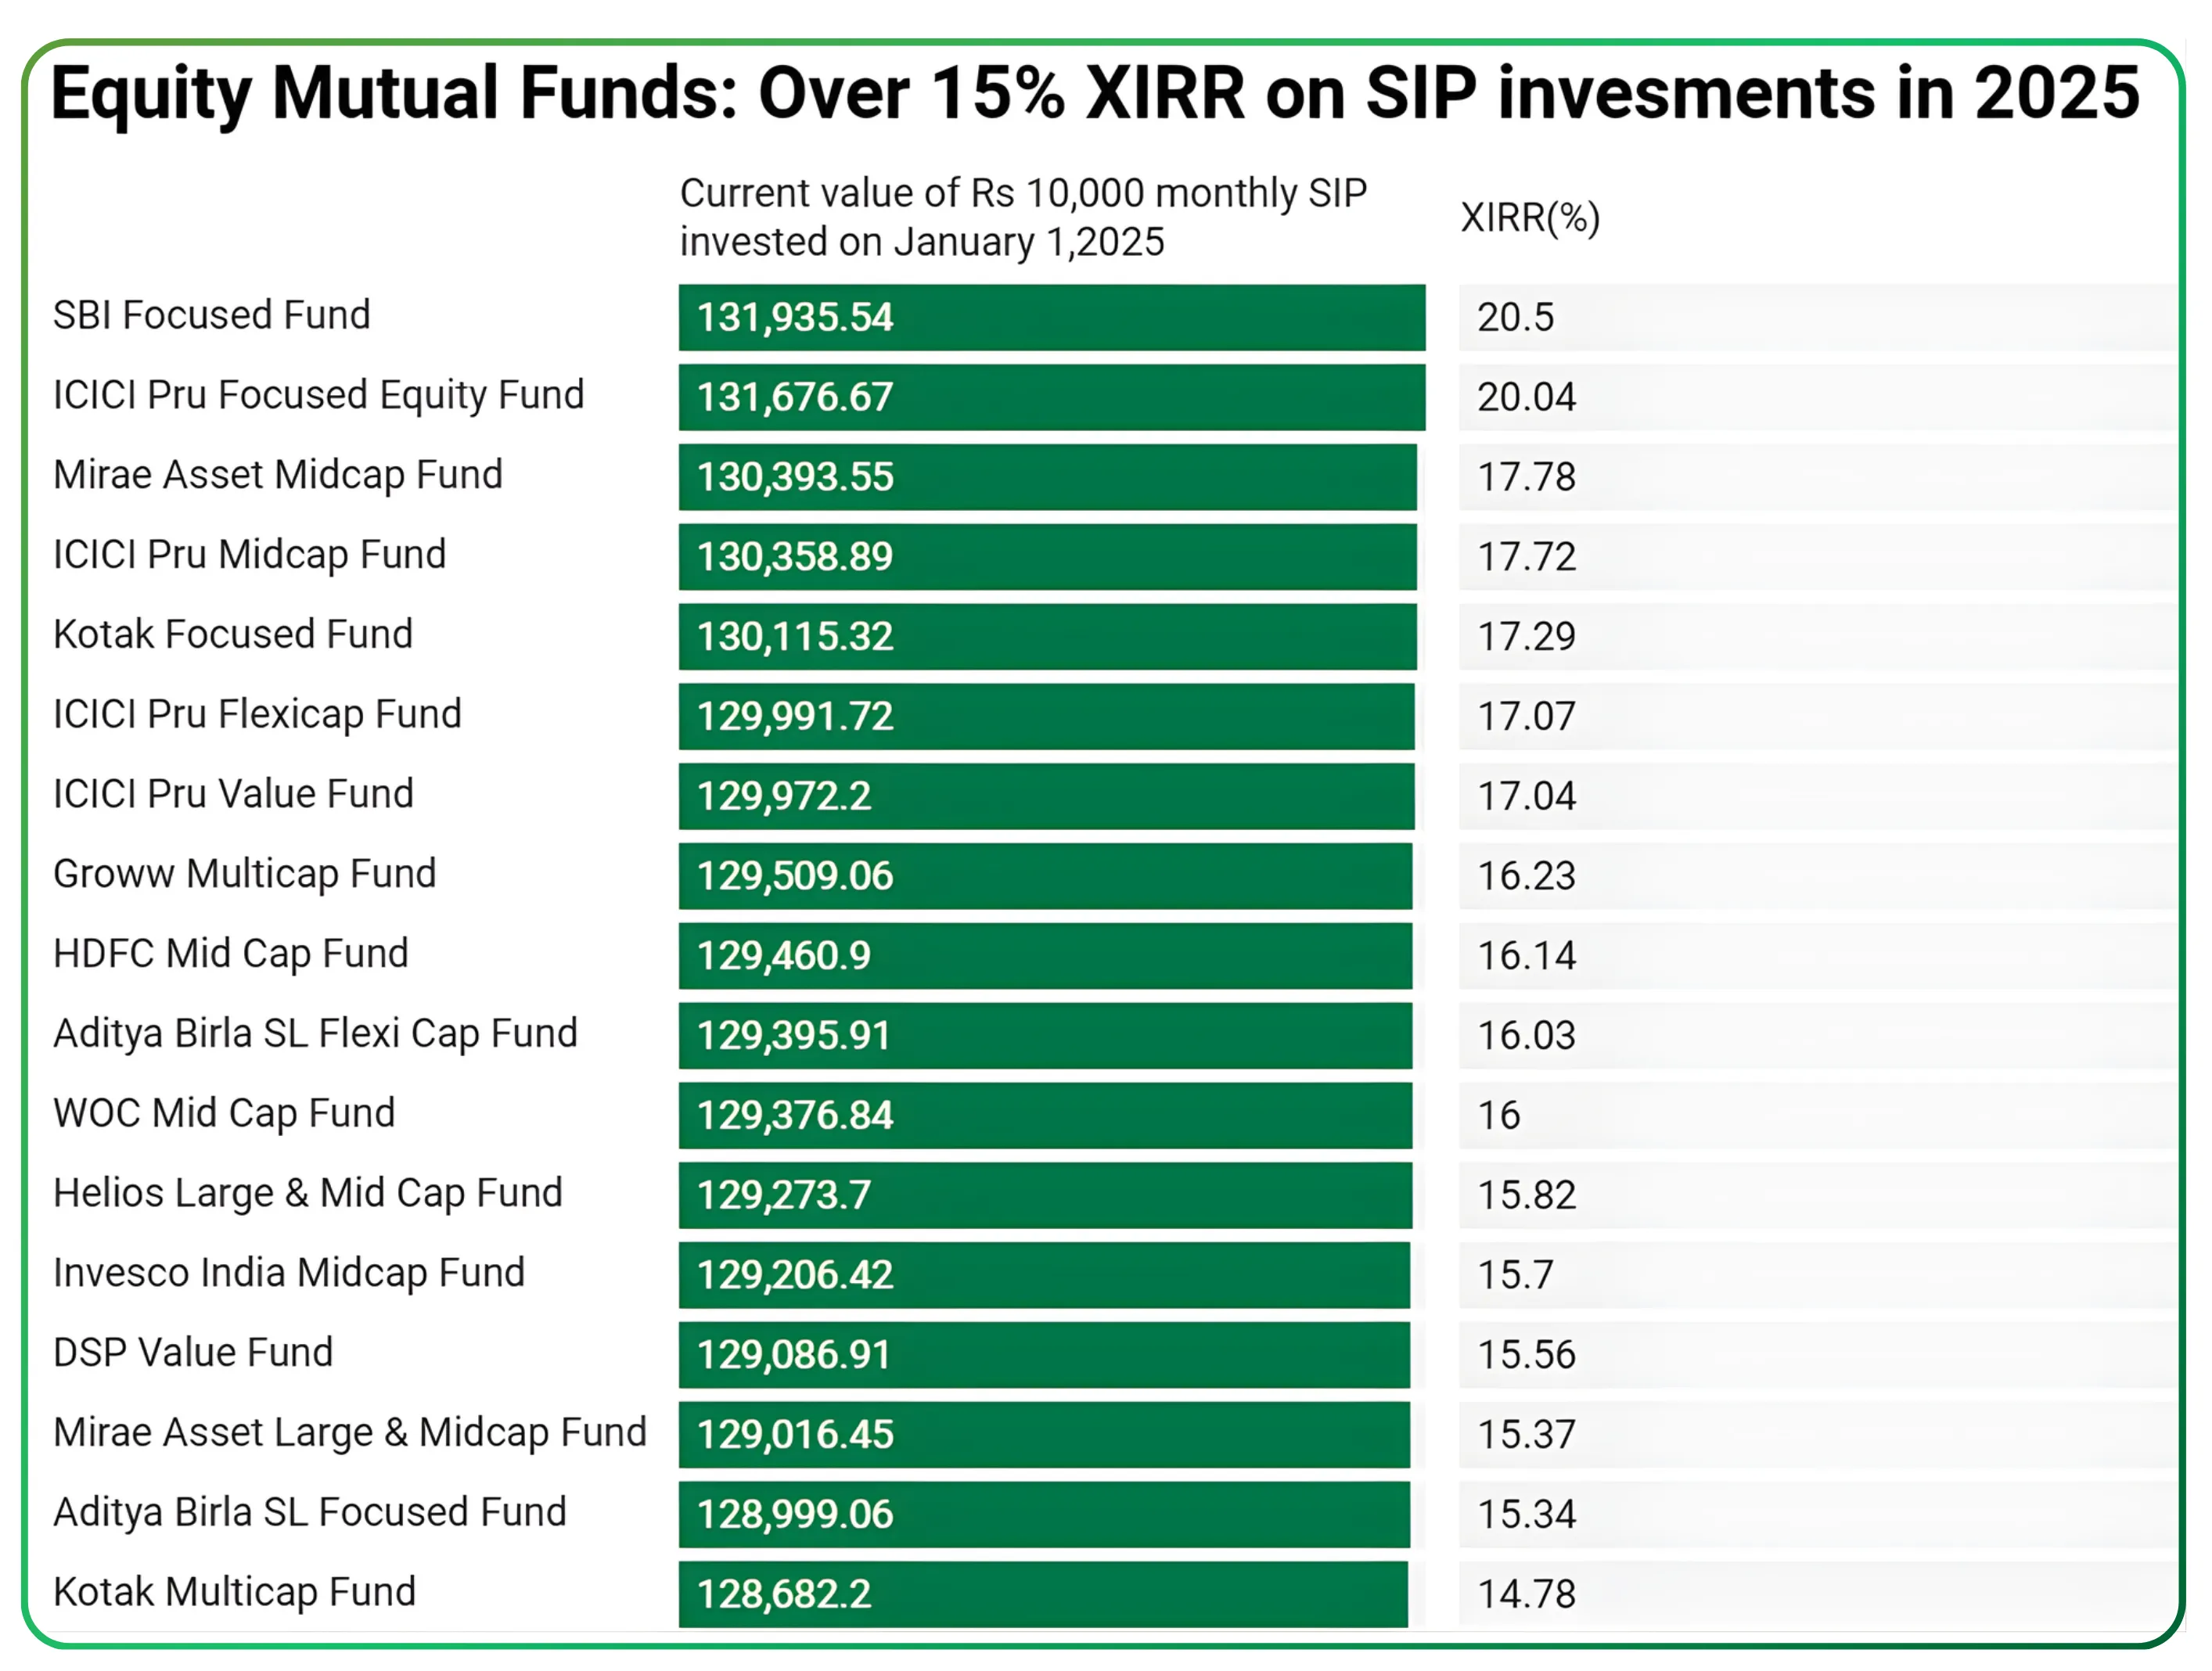
Source: (XIRR from January 1,2025 to Decemberr 18,2025)
Chart: Surbhi Khanna * Source: ACE MF
Importance of benchmark comparison
Just like one shoe doesn’t fit everyone, one return number cannot define what is “good” for every mutual fund investor. Your expectations should be aligned with what the market can realistically deliver, not with unrealistic targets. Equity market returns ultimately revolve around market cycles and, in the long run, tend to move closer to the returns of the benchmark index. Expecting returns far beyond the index is possible in certain phases, but it is neither guaranteed nor sustainable at all times. As the table shows, even in just one year, different mutual funds delivered different results because each fund, each period, and each market phase behaves differently. But remember, one year is a very short time frame. Nobody invests in equity mutual funds with just a 1-year goal. Equity mutual funds are meant for wealth creation over longer horizons, where disciplined investing, realistic expectations, and patience matter far more than chasing the highest XIRR every year.
What is a good XIRR? Why context matters more than numbers
There is no single perfect number that fits everyone. Evaluating investment returns using appropriate metrics like XIRR helps investors make informed decisions by providing a clearer picture of performance over time. Markets move up and down and short term investment returns can look very high or very low. That is why looking at XIRR for only one or two years can be misleading.
When considering what counts as a good XIRR, it's important to remember that the expertise and track record of fund managers play a crucial role in delivering consistent risk-adjusted returns. Investors should consider the fund manager's performance in addition to the XIRR number.
Summary Table: What is a good XIRR?
| Fund Type | Good XIRR Range | Key Consideration |
|---|---|---|
| Equity Mutual Funds | 12% – 15%+ | Should exceed inflation and benchmark returns |
| Aggressive Equity Funds | 16% – 18% | Higher risk, may outperform in bull markets |
| Debt Mutual Funds | 7% – 8% | Should exceed inflation, compare with peers |
| Conservative Debt Funds | 6% – 10% | Satisfactory for low-risk, stable returns |
Key Points:
- A good XIRR should always exceed the inflation rate for real wealth growth.
- Compare your fund’s XIRR with its benchmark (e.g., Nifty, Sensex) and similar funds.
- Long-term consistency is more important than short-term spikes.
Next, let’s see how market cycles can impact your XIRR and why it changes over time.
XIRR can look different for each market cycles
Impact of Market Cycles on XIRR
The answer lies in market cycles and cash flows occurring at favourable times. Some recent years have been very strong for equities, especially the covid phase, which has boosted mutual fund returns XIRR. But markets will not remain like this forever. There will always be phases of correction and consolidation. So consistent double digit investment performance over long periods is far more powerful than chasing unusually high numbers
Why XIRR Changes Over Time
Market cycles and how your SIP cash flows coincide with them. XIRR is highly time-sensitive and if more of your investments happen during strong market phases, your XIRR looks higher. If large SIP amounts fall during corrections, the XIRR may appear lower in case trend remains the same That is why different periods (1 year, 3 years, 5 years) can show different XIRR values, and it will continue to change every year as markets move through bull, bear, and consolidation phases. Some recent years have been exceptionally strong for equities, boosting XIRR, but markets will not always remain the same. There will always be phases of correction and consolidation..
| SIP Amount | ₹ 10,000 |
|---|---|
| Frequency | Monthly |
| 1 Year amount invested | ₹1,20,000 |
| 3 Year amount invested | ₹3,60,000 |
| 5 Year amount invested | ₹6,00,000 |
| Scheme Name | 1 Year Fund Value | 1 Year XIRR | 3 Year Fund Value | 3 Year XIRR | 5 Year Fund Value | 5 Year XIRR |
|---|---|---|---|---|---|---|
| Parag Parikh Flexi Fund (G) | ₹1,26,969 | 11.49% | ₹4,66,209 | 17.81% | ₹9,45,372 | 18.40% |
| Nippon India Flexi Cap Fund (G) | ₹1,27,490 | 12.37% | ₹4,41,632 | 13.96% | — | — |
| Canara Rob Flexi Cap Fund (G) | ₹1,28,957 | 14.85% | ₹4,51,244 | 15.48% | ₹8,74,132 | 15.18% |
| HDFC Flexi Cap Fund (G) | ₹1,29,133 | 15.14% | ₹4,79,156 | 19.79% | ₹10,20,351 | 21.57% |
Understanding how XIRR fluctuates with market cycles helps you set realistic expectations for your investments. Next, let’s clarify how XIRR compares to other return metrics like Absolute Return and CAGR.
Absolute Return vs CAGR vs XIRR
What is Absolute Return?
Many investors look only at absolute current value and feel happy seeing a high percentage. But absolute returns do not tell you how many years it took or when the money was invested.
When to Use Compound annual growth rate (CAGR)
CAGR is better for lump sum investments because it considers investment duration. However, it assumes only one initial investment at the beginning.
Why XIRR is Preferred for SIPs
XIRR function is more relevant for mutual fund sip, sip investments, and practical investing because it considers every cash flow values, withdrawals, negative values, date cash flow, net present value, initial investment amount, total investment value, final value, and corresponding cash flows.
That is why platforms, advisors, and financial advisor professionals prefer using XIRR while evaluating mutual fund returns.
Comparison Table: Absolute Return vs CAGR vs XIRR
| Metric | Best For | Considers Timing? | Use Case |
|---|---|---|---|
| Absolute Return | Any investment | No | Simple gain/loss calculation, ignores time |
| CAGR | Lump sum investments | No (single point) | Measures annual growth rate for one-time investments |
| XIRR | SIPs, multiple cash flows | Yes | Calculates annualized return for irregular cash flows |
Now that you know how to measure returns, let’s discuss when you should actually worry about your XIRR.
When should you actually worry about your XIRR?
Instead of reacting to every market change, it is better to review your personal investments thoughtfully.
Ask yourself a few important questions:
- Is your mutual fund’s performance beating its benchmark over a reasonable period such as five years or more?
- Are you comparing the right category with the right benchmark, for example a large cap equity mutual fund with a large cap index?
- Are you reviewing your investments patiently?
If the answers are positive, short term fluctuations in XIRR and XIRR single digit for short term should not bother you. Always allow the first two years for the fund to settle, then reviewing every six months, and verify XIRR.
By regularly asking these questions, you can focus on long-term growth rather than short-term volatility. Next, let’s summarize what a good XIRR really means for your investment journey.
The real meaning of a good XIRR
XIRR helps you understand your actual real world investment returns, but the number should always be viewed in a long term context. A good XIRR is not about being the highest. It is about being consistent, sustainable, and better than inflation and benchmarks.
If your investment portfolio is delivering around 14% to 18% annually over the long term, you are already on a very healthy path of wealth creation.
In the end, successful investment decisions are not about chasing the most exciting numbers. They are about staying disciplined, realistic, and patient so that compounding can do its work over time when you invest money wisely according to your risk tolerance and investment objectives.
Disclaimer: The information provided in our blogs is for informational purposes only and should not be construed as financial, investment, or trading advice. Trading and investing in the securities market carries risk. Always conduct your own research and consult with a qualified financial advisor before making any investment decisions. Past performance is not indicative of future results. Copyrighted and original content for your trading and investing needs.
© 2025 — Tradejini. All Rights Reserved.